

Answered step by step
Verified Expert Solution
Question
1 Approved Answer
Given a csv file with numerical data, I would like to plot one row of data as X - axis, one column of data as
Given a csv file with numerical data, I would like to plot one row of data as Xaxis, one column of data as Yaxis and generate a XY plot using Python. Please provide the Python code. Thanks.
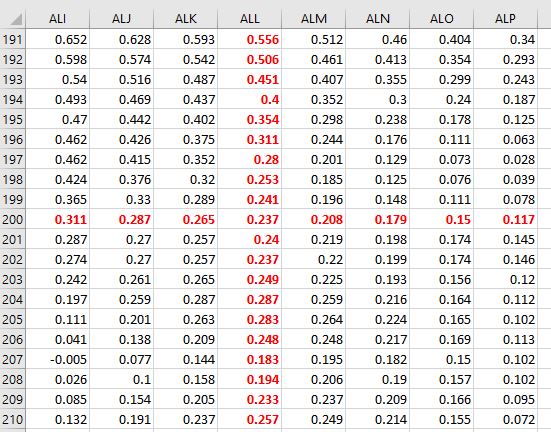
What if there is no rowname and columnname in the cvs file? All I know is I like to plot row and column 'ALL' similar to what you see below in an Excel file.
tableALIALJ,ALK,ALL,ALM,ALN,ALO,ALP
Step by Step Solution
There are 3 Steps involved in it
Step: 1

Get Instant Access to Expert-Tailored Solutions
See step-by-step solutions with expert insights and AI powered tools for academic success
Step: 2

Step: 3
Ace Your Homework with AI
Get the answers you need in no time with our AI-driven, step-by-step assistance
Get Started
Statistical And Scientific Database Management Fifth International Conference V Ssdbm Charlotte N C Usa April 3 5 1990 Proceedings Lncs 420
Authors: Zbigniew Michalewicz
1st Edition
3540523421, 978-3540523420