Answered step by step
Verified Expert Solution
Question
1 Approved Answer
Given a function f, use the following steps to sketch a graph of f: 1. Determine the domain of the function. 2. Locate the

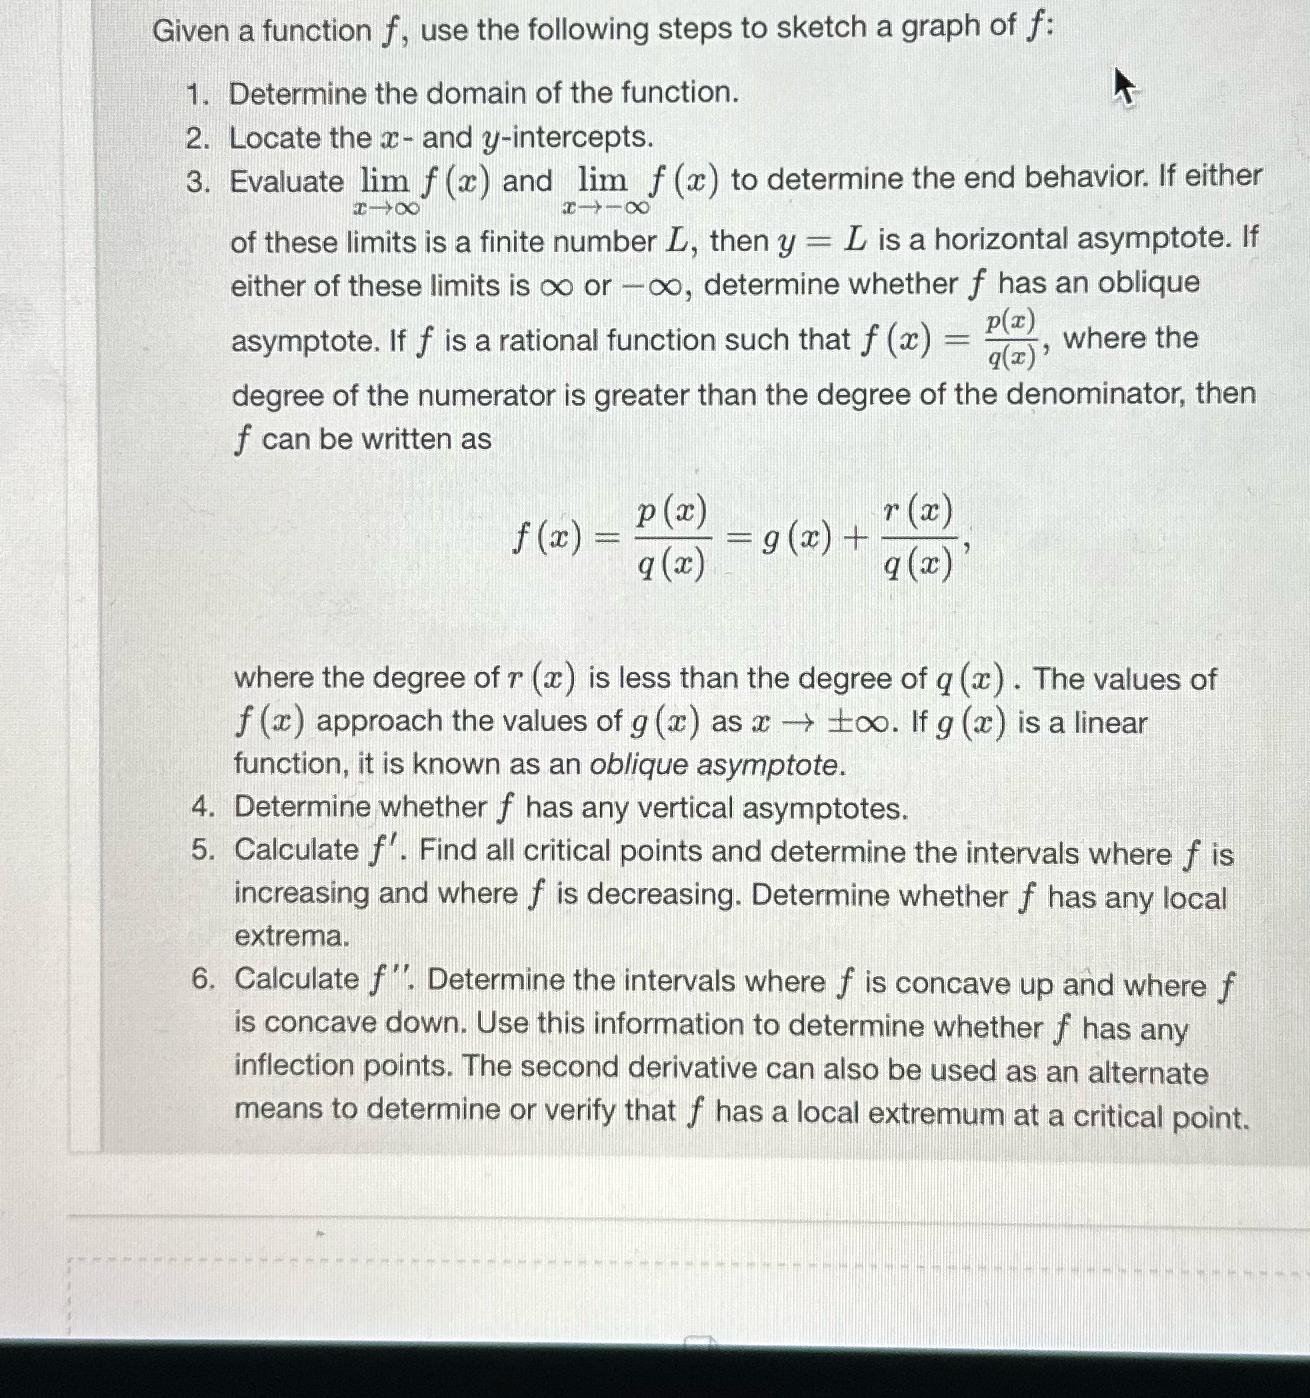
Given a function f, use the following steps to sketch a graph of f: 1. Determine the domain of the function. 2. Locate the x- and y-intercepts. 3. Evaluate lim f (x) and lim f (x) to determine the end behavior. If either XX of these limits is a finite number L, then y - L is a horizontal asymptote. If either of these limits is or -, determine whether f has an oblique asymptote. If f is a rational function such that f (x) = p(x) 9(x)' where the degree of the numerator is greater than the degree of the denominator, then f can be written as f(x) = p(x) q(x) r(x) = g(x) + q(x)' where the degree of r (x) is less than the degree of q(x). The values of f(x) approach the values of g (x) as x oo. If g (x) is a linear function, it is known as an oblique asymptote. 4. Determine whether f has any vertical asymptotes. 5. Calculate f'. Find all critical points and determine the intervals where f is increasing and where f is decreasing. Determine whether f has any local extrema. 6. Calculate f". Determine the intervals where f is concave up and where f is concave down. Use this information to determine whether f has any inflection points. The second derivative can also be used as an alternate means to determine or verify that f has a local extremum at a critical point.
Step by Step Solution
★★★★★
3.38 Rating (160 Votes )
There are 3 Steps involved in it
Step: 1
Okay here are the steps to sketch the graph of the function ...
Get Instant Access to Expert-Tailored Solutions
See step-by-step solutions with expert insights and AI powered tools for academic success
Step: 2

Step: 3

Ace Your Homework with AI
Get the answers you need in no time with our AI-driven, step-by-step assistance
Get Started


