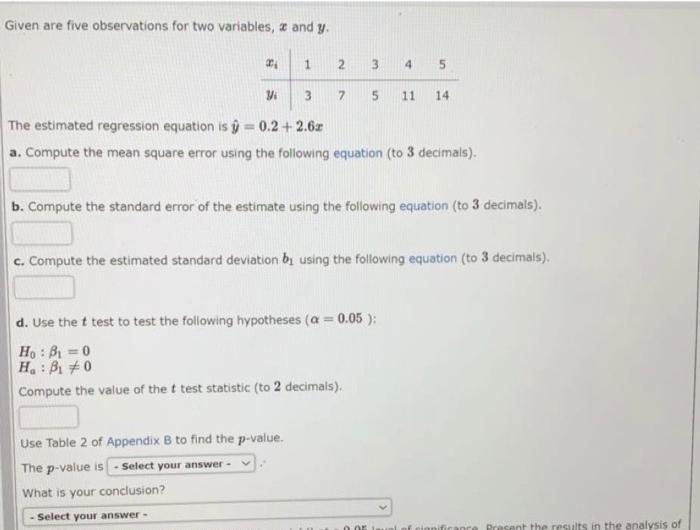
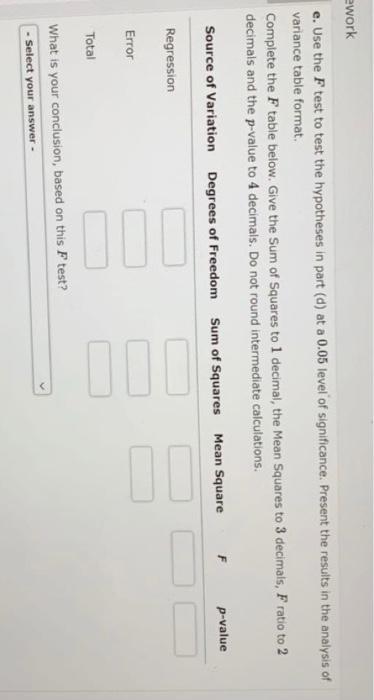
Given are five observations for two variables, 2 and y. 2 1 2 3 5 W 3 7 5 11 14 The estimated regression equation is = 0.2+2.62 a. Compute the mean square error using the following equation (to 3 decimals). b. Compute the standard error of the estimate using the following equation (to 3 decimals). c. Compute the estimated standard deviation b using the following equation (to 3 decimals) d. Use the t test to test the following hypotheses (a = 0.05 ); H: Bi = 0 H: B170 Compute the value of the t test statistic (to 2 decimals). Use Table 2 of Appendix B to find the p-value. The p-value is - Select your answer What is your conclusion? - Select your answer - nificance Present the results in the analysis of ework e. Use the F test to test the hypotheses in part (d) at a 0.05 level of significance. Present the results in the analysis of variance table format. Complete the F table below. Give the Sum of Squares to 1 decimal, the Mean Squares to 3 decimals, F ratio to 2 decimals and the p-value to 4 decimals. Do not round intermediate calculations. F Mean Square Sum of Squares Source of Variation Degrees of Freedom p-value Regression II Error Total What is your conclusion, based on this F test? - Select your answer Given are five observations for two variables, 2 and y. 2 1 2 3 5 W 3 7 5 11 14 The estimated regression equation is = 0.2+2.62 a. Compute the mean square error using the following equation (to 3 decimals). b. Compute the standard error of the estimate using the following equation (to 3 decimals). c. Compute the estimated standard deviation b using the following equation (to 3 decimals) d. Use the t test to test the following hypotheses (a = 0.05 ); H: Bi = 0 H: B170 Compute the value of the t test statistic (to 2 decimals). Use Table 2 of Appendix B to find the p-value. The p-value is - Select your answer What is your conclusion? - Select your answer - nificance Present the results in the analysis of ework e. Use the F test to test the hypotheses in part (d) at a 0.05 level of significance. Present the results in the analysis of variance table format. Complete the F table below. Give the Sum of Squares to 1 decimal, the Mean Squares to 3 decimals, F ratio to 2 decimals and the p-value to 4 decimals. Do not round intermediate calculations. F Mean Square Sum of Squares Source of Variation Degrees of Freedom p-value Regression II Error Total What is your conclusion, based on this F test? - Select your