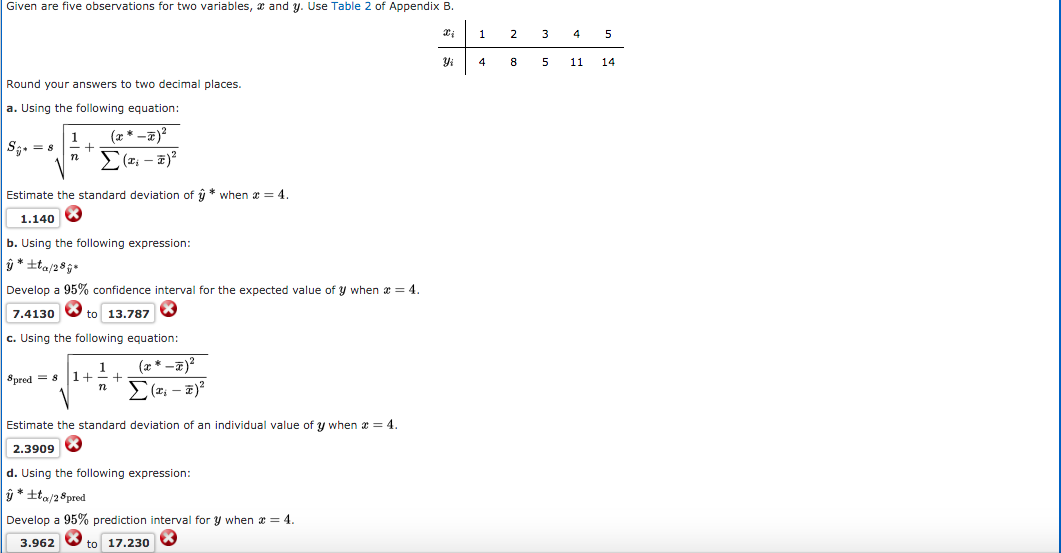
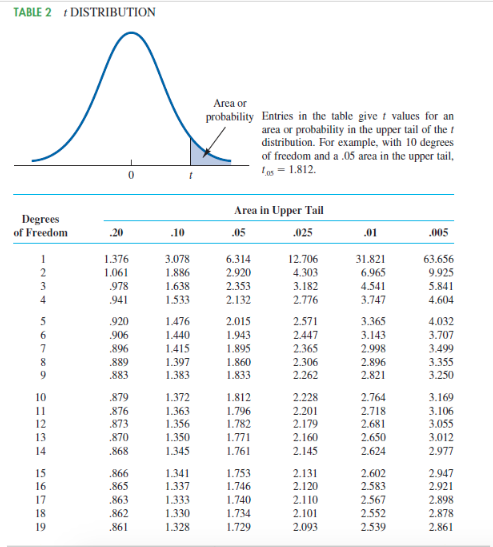
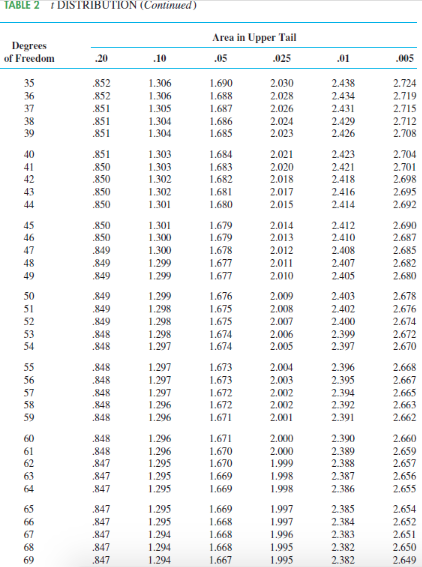
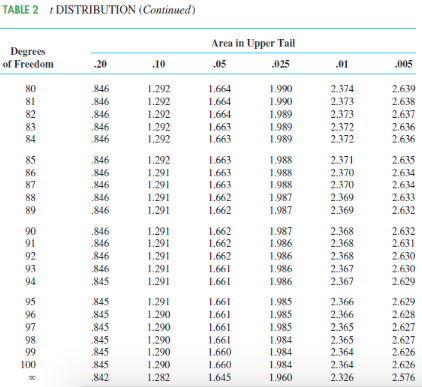
Given are five observations for two variables, @ and y. Use Table 2 of Appendix B. 1 2 3 4 5 4 8 5 11 14 Round your answers to two decimal places. a. Using the following equation: Estimate the standard deviation of y * when a = 4. 1.140 b. Using the following expression: y * tta/28;. Develop a 95% confidence interval for the expected value of y when * = 4. 7.4130 to 13.787 c. Using the following equation: 8pred = 8 1+ + Estimate the standard deviation of an individual value of y when * = 4. 2.3909 d. Using the following expression: y * +to/28pred Develop a 95% prediction interval for y when * = 4. 3.962 to 17.230 XTABLE 2 DISTRIBUTION Area or probability Entries in the table give f values for an area or probability in the upper tail of the f distribution. For example, with 10 degrees of freedom and a .05 area in the upper tail. 0 Ins = 1.812. Degrees Area In Upper Tail of Freedom .20 10 05 .025 01 -005 1.376 3.078 6.314 12.706 31.821 1.061 63.656 1.886 2.920 4.303 6.965 9.925 .978 1.638 2.353 3.182 4.541 941 5.841 1.533 2.132 2.776 3.747 4.604 .920 1.476 2015 2.571 3.365 4.032 .906 1.440 1.943 2.447 3.143 .896 3.707 1.415 1.895 2.365 2.998 3.499 .889 1.397 1.860 2.306 2.896 .883 1.383 3.355 1.833 2.262 2.821 3.250 .879 1.372 1.812 2.228 2.764 3.169 .876 1.363 1.796 2.201 .873 2.718 3.106 1.356 1.782 2.179 2.681 .870 3.055 1.350 1.771 2.160 14 2.650 3.012 .868 1.345 1.761 2.145 2.624 2.977 15 .866 1.341 1.753 2.131 16 2.602 .865 2.947 1.337 1.746 2.120 17 2.583 .863 2.921 1.333 1.740 2.110 18 2.567 .862 2.898 1.330 1.734 2.101 19 2.552 2.878 .861 1.328 1.729 2.093 2.539 2.861TABLE 2 . DISTRIBUTION (Continued ) Degrees Area in Upper Tail of Freedom 20 .10 .05 .025 .01 005 35 .852 1.306 1.690 2.030 2.438 36 2.724 .852 1.306 1.688 2.028 2.434 37 2.719 .851 1.305 1.687 2.026 2.431 2.715 38 .851 1.304 1.686 2.024 39 2.429 2.712 .851 1.304 1.685 2.023 2.426 2.708 40 .851 1.303 1.684 2.021 2.423 41 2.704 .850 1.303 1.683 2.020 2.421 42 2.701 .850 1.302 1.682 2.018 2.418 43 2.698 .850 1.302 1.681 2.017 2.416 44 2.695 .850 1.301 1.680 2.015 2414 2.692 45 .850 1.301 1.679 2.014 2.412 2.690 .850 1.300 1.679 2.013 2410 47 2.687 .849 1.300 1.678 2.012 2.408 48 2.685 .849 1.299 1.677 2.011 2.407 49 2.682 .849 1.299 1.677 2.010 2.405 2.680 50 .849 1.299 1.676 2.009 2.403 51 2.678 .849 1,298 1.675 2.008 2.402 52 2.676 .849 1.298 1.675 2.007 2.400 53 2.674 .848 1.298 1.674 2.006 2.399 54 2.672 .848 1.297 1.674 2.005 2.397 2.670 55 .848 1.297 1.673 2.004 2.396 56 2.668 .848 1.297 1.673 2.003 2.395 57 2.667 .848 1.297 1.672 2.002 2.394 58 2.665 .848 1.296 1.672 2.002 2.392 59 2.663 .848 1.296 1.671 2.001 2.391 2.662 60 .848 1.296 1.671 2.000 2.390 2.660 .848 1.296 1.670 2.000 2.389 2.659 .847 1.295 1.670 1.999 2.388 2.657 .847 1.295 1.669 1.998 2.387 2.656 .847 1.295 1.669 1.998 2.386 2.655 .847 1.295 1.669 1.997 2.385 2.654 .847 1.295 1.668 1.997 2.384 2.652 .847 1.294 1.668 1.996 2.383 2.651 .847 1.294 1.668 1.995 2.382 2.650 .847 1.294 1.667 1.995 2.382 2.649TABLE 2 DISTRIBUTION (Continued ) Degrees Area In Upper Tail of Freedom .20 .10 05 -025 .01 -005 80 846 1.292 1.664 1.990 2.374 81 2.639 .846 1.292 1.664 1.990 2.373 82 2.638 846 1.292 1.664 1.989 2.373 83 2.637 846 1.292 1.663 1.989 84 2.372 846 2.636 1.292 1.663 1.989 2.372 2.636 85 846 1.292 1.663 1.988 2.371 86 2.635 846 1.291 1.663 1.988 87 2.370 846 2.634 1.291 1.663 1.988 2.370 88 2.634 846 1.291 1.662 1.987 2.369 89 2.633 846 1.291 1.662 1.987 2.369 2.632 90 846 1.291 1.662 1.987 91 2.368 846 1.291 2.632 1.662 1.986 2.368 92 2.631 .846 1.291 1.662 1.986 2.368 93 2.630 846 1.291 1.661 1.986 2.367 94 2.630 845 1.291 1.661 1.986 2.367 2.629 95 845 1.291 1.661 1.985 96 2.366 2.629 .845 1.290 1.661 1.985 2.366 97 2.628 845 1.290 1.661 1.985 2.365 98 845 2.627 1.290 1.661 1.984 99 2.365 845 2.627 1.290 1.660 1.984 2.364 100 845 2.626 1.290 1.660 1.984 2.364 2.626 .842 1.282 1.645 1.960 2.326 2.576