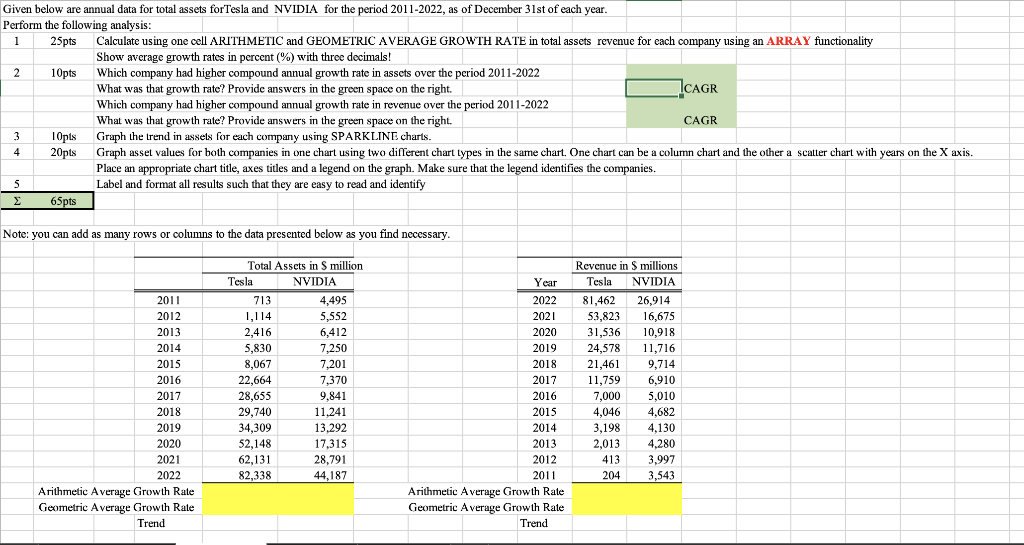
Given below are annual data for total assets forTesla and NVIDIA for the period 2011-2022, as of December 31st of each year. Perform the following analysis: 1 25pts Calculate using one cell ARITHMETIC and GEOMETRIC A VERAGE GROWTH RATE in total assets revenue for each company using an ARRAY functionality Show average growth rates in percent (%) with three decimals! \begin{tabular}{|l|l|l|} \hline 2 & 10pts & Which company had higher compound annual growth rate in assets over the period 2011-2022 \\ & What was that growth rate? Provide answers in the green space on the right. \\ Which company had higher compound annual growth rate in revenue over the period 2011-2022 \\ \hline & What was that growth rate? Provide answers in the green space on the right. \\ \hline & CAGG \\ \hline \end{tabular} \begin{tabular}{|l|l|} \hline 3 & 10pts \\ \hline 4 & 20pts \\ \hline & \\ \hline 5 & \\ \hline & 65pts \\ \hline \end{tabular} Note: you can add as many rows or columns to the data presented below as you find necessary. Graph asset values for both companies in one chart using two different chart types in the same chart. One chart can be a column chart and the other a scalter chart with years on the X axis. Place an appropriate chart title, axes titles and a legend on the graph. Make sure that the legend identifies the companies. Label and format all results such that they are easy to read and identify \begin{tabular}{|l|l|r|r|} \hline & \multicolumn{3}{|c|}{} \\ \cline { 2 - 4 } & & \multicolumn{2}{|c|}{ Total Assets in S million } \\ \cline { 2 - 4 } & & \multicolumn{1}{|c|}{ Tesla } & NVIDIA \\ \hline \hline \hline 2011 & 713 & 4,495 \\ \hline & 2012 & 1,114 & 5,552 \\ \hline & 2013 & 2,416 & 6,412 \\ \hline & 2014 & 5,830 & 7,250 \\ \hline & 2015 & 8,067 & 7,201 \\ \hline & 2016 & 22,664 & 7,370 \\ \hline & 2017 & 28,655 & 9,841 \\ \hline & 2018 & 29,740 & 11,241 \\ \hline 2019 & 34,309 & 13,292 \\ \hline & 2020 & 52,148 & 17,315 \\ \hline & 2021 & 62,131 & 28,791 \\ \hline & 2022 & 82,338 & 44,187 \\ \hline \end{tabular} \begin{tabular}{|r|r|r|} \hline & \multicolumn{2}{c}{ Revenue in \$ millions } \\ \cline { 2 - 3 } Year & \multicolumn{1}{|c|}{ Tesla } & NVIDIA \\ \hline \hline 2022 & 81,462 & 26,914 \\ \hline 2021 & 53,823 & 16,675 \\ \hline 2020 & 31,536 & 10,918 \\ \hline 2019 & 24,578 & 11,716 \\ \hline 2018 & 21,461 & 9,714 \\ \hline 2017 & 11,759 & 6,910 \\ \hline 2016 & 7,000 & 5,010 \\ \hline 2015 & 4,046 & 4,682 \\ \hline 2014 & 3,198 & 4,130 \\ \hline 2013 & 2,013 & 4,280 \\ \hline 2012 & 413 & 3,997 \\ \hline 2011 & 204 & 3,543 \\ \hline \end{tabular} Arithmetic Average Growth Rate Arithmetic A verage Growth Rate Geometric Average Growth Rate Geometric Average Growth Rate Trend Trend