Answered step by step
Verified Expert Solution
Link Copied!

Question

1 Approved Answer

Given below is a bar graph that depicts the number of units of cars sold in each year from year 2005 to 2010. Study the
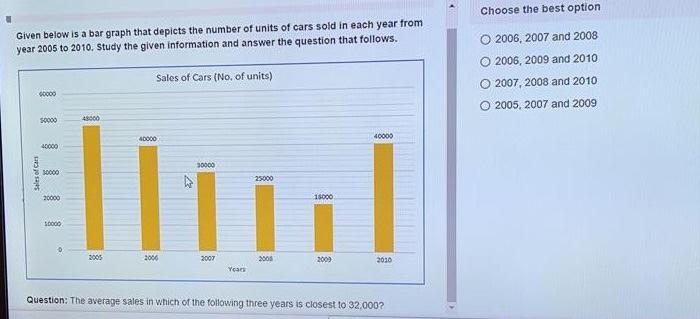
image text in transcribed
Given below is a bar graph that depicts the number of units of cars sold in each year from year 2005 to 2010. Study the given information and answer the question that follows. Choose the best option O 2006, 2007 and 2008 O 2006, 2009 and 2010 O 2007, 2008 and 2010 2005, 2007 and 2009 Sales of Cars (No. of units) 000 50000 48000 40000 40000 45000 30000 Sales of Cars 0000 25000 20000 15000 10000 2005 2006 2007 2008 2009 2030 Years Question: The average sales in which of the following three years is closest to 32.000

Step by Step Solution

There are 3 Steps involved in it

Step: 1

blur-text-image

Get Instant Access to Expert-Tailored Solutions

See step-by-step solutions with expert insights and AI powered tools for academic success

Step: 2

blur-text-image

Step: 3

blur-text-image

Ace Your Homework with AI

Get the answers you need in no time with our AI-driven, step-by-step assistance

Get Started

Recommended Textbook for

Long Term Care Your Financial Planning Guide

Authors: Phyllis Shelton

1st Edition

978-0963351692

More Books

Students also viewed these Finance questions

Question

1. Television more Over watching faceing of many problems ?

Answered: 1 week ago

Question

Is there a link between chronic stress and memory function?

Answered: 1 week ago