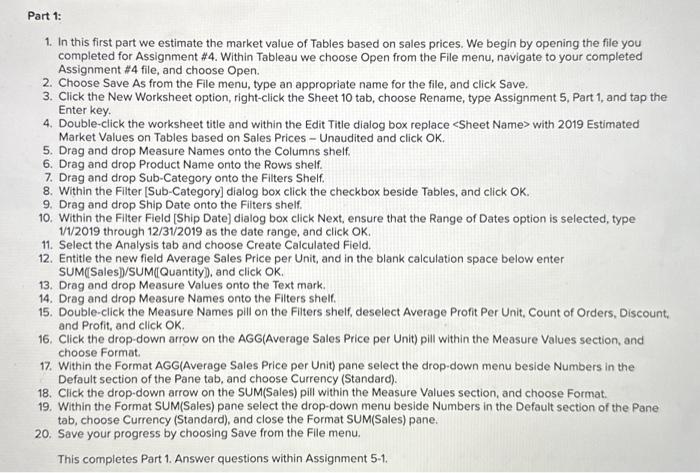
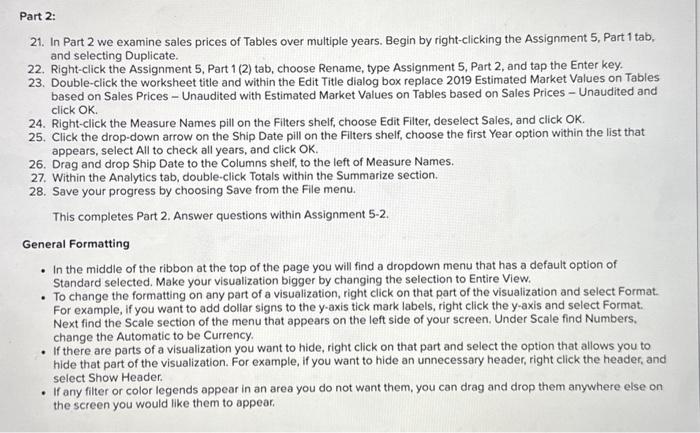
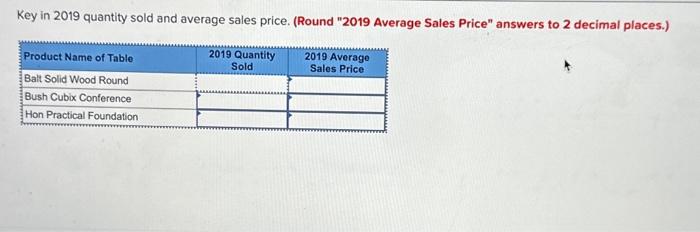
Given Information: The following information will be used for this assignment: - The years with complete orders data are 2016-2019. Assume that the data for the years 2016-2018 is audited, while 2019 is unaudited. - Assume your firm is beginning the audit of 2019. - Superstore ships all goods FOB shipping point. Accordingly, for financial reporting purposes it records sales at the Ship Date. Note, this is a different date than was used in the Tableau Tutorial that you used for the first two assignments. If you decide to go back to the first two assignments, continue to do them as presented in the Tableau Tutorial. But for Assignments 3 to 5 use Ship Date throughout. - In Assignments 3 to 5 we will not use any 2020 transactions included in the Superstore data file. Again, the date we will use is Ship Date. 1. In this first part we estimate the market value of Tables based on sales prices. We begin by opening the file you completed for Assignment \#4. Within Tableau we choose Open from the File menu, navigate to your completed Assignment \#4 file, and choose Open. 2. Choose Save As from the File menu, type an appropriate name for the file, and click Save. 3. Click the New Worksheet option, right-click the Sheet 10 tab, choose Rename, type Assignment 5, Part 1, and tap the Enter key. 4. Double-click the worksheet title and within the Edit Title dialog box replace with 2019 Estimated Market Values on Tables based on Sales Prices - Unaudited and click OK. 5. Drag and drop Measure Names onto the Columns shelf. 6. Drag and drop Product Name onto the Rows shelf. 7. Drag and drop Sub-Category onto the Filters Shelf. 8. Within the Filter [Sub-Category] dialog box click the checkbox beside Tables, and click OK. 9. Drag and drop Ship Date onto the Filters shelf. 10. Within the Filter Field [Ship Date] dialog box click Next, ensure that the Range of Dates option is selected, type 1/1/2019 through 12/31/2019 as the date range, and click OK. 11. Select the Analysis tab and choose Create Calculated Field. 12. Entitle the new field Average Sales Price per Unit, and in the blank calculation space below enter SUM(Sales])/SUM([Quantity), and click OK. 13. Drag and drop Measure Values onto the Text mark. 14. Drag and drop Measure Names onto the Filters shelf. 15. Double-click the Measure Names pill on the Filters shelf, deselect Average Profit Per Unit, Count of Orders, Discount, and Profit, and click OK. 16. Click the drop-down arrow on the AGG(Average Sales Price per Unit) pill within the Measure Values section, and choose Format. 17. Within the Format AGG(Average Sales Price per Unit) pane select the drop-down menu beside Numbers in the Default section of the Pane tab, and choose Currency (Standard). 18. Click the drop-down arrow on the SUM(Sales) pill within the Measure Values section, and choose Format. 19. Within the Format SUM(Sales) pane select the drop-down menu beside Numbers in the Default section of the Pane tab, choose Currency (Standard), and close the Format SUM(Sales) pane. 20. Save your progress by choosing Save from the File menu. This completes Part 1. Answer questions within Assignment 5-1. 21. In Part 2 we examine sales prices of Tables over multiple years. Begin by right-clicking the Assignment 5 , Part 1 tab, and selecting Duplicate. 22. Right-click the Assignment 5, Part 1 (2) tab, choose Rename, type Assignment 5, Part 2, and tap the Enter key. 23. Double-click the worksheet title and within the Edit Title dialog box replace 2019 Estimated Market Values on Tables based on Sales Prices - Unaudited with Estimated Market Values on Tables based on Sales Prices - Unaudited and click OK. 24. Right-click the Measure Names pill on the Filters shelf, choose Edit Filter, deselect Sales, and click OK. 25. Click the drop-down arrow on the Ship Date pill on the Filters shelf, choose the first Year option within the list that appears, select All to check all years, and click OK. 26. Drag and drop Ship Date to the Columns shelf, to the left of Measure Names. 27. Within the Analytics tab, double-click Totals within the Summarize section. 28. Save your progress by choosing Save from the File menu. This completes Part 2. Answer questions within Assignment 5-2. General Formatting - In the middle of the ribbon at the top of the page you will find a dropdown menu that has a default option of Standard selected. Make your visualization bigger by changing the selection to Entire View. - To change the formatting on any part of a visualization, right click on that part of the visualization and select Format. For example, if you want to add dollar signs to the y-axis tick mark labels, right click the y-axis and select Format. Next find the Scale section of the menu that appears on the left side of your screen. Under Scale find Numbers. change the Automatic to be Currency. - If there are parts of a visualization you want to hide, right click on that part and select the option that allows you to hide that part of the visualization. For example, if you want to hide an unnecessary header, right click the header, and select Show Header. - If any filter or color legends appear in an area you do not want them, you can drag and drop them anywhere else on the screen you would like them to appear. Key in 2019 quantity sold and average sales price. (Round "2019 Average Sales Price" answers to 2 decimal places.)