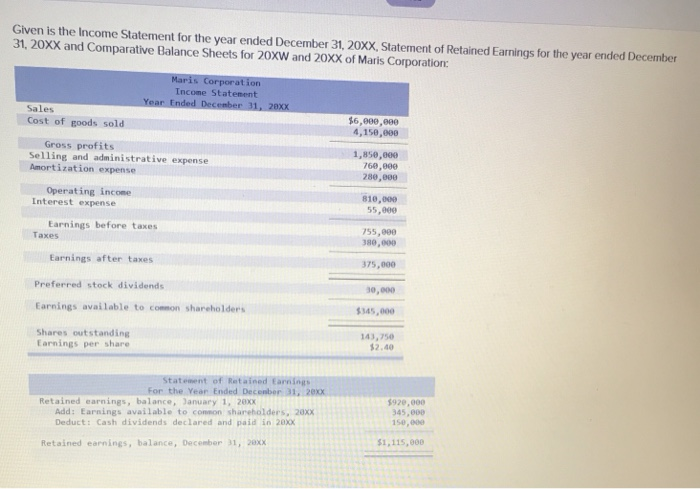
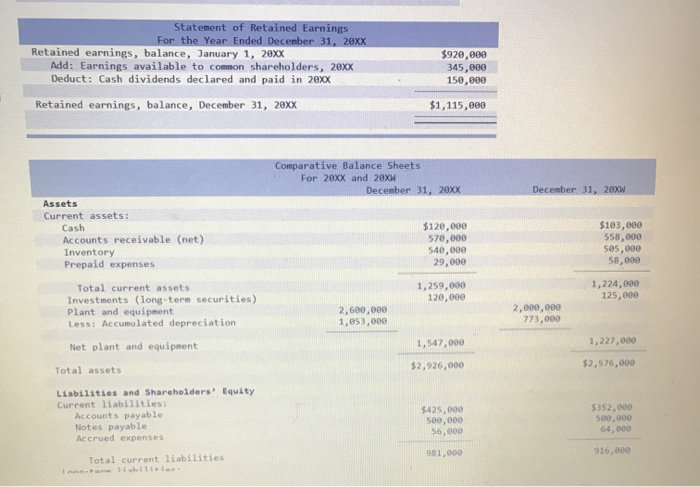
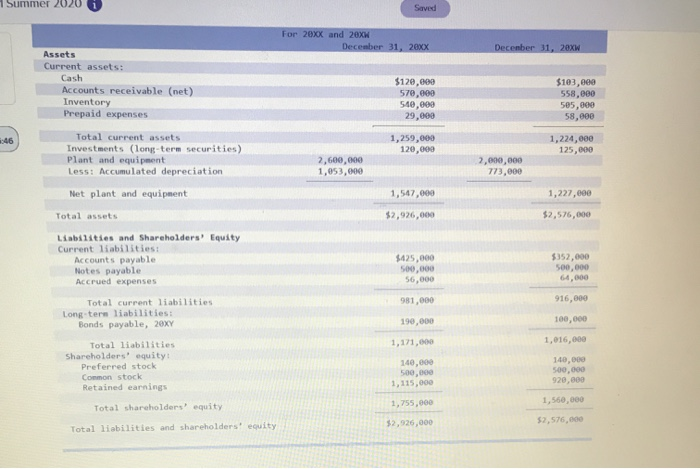
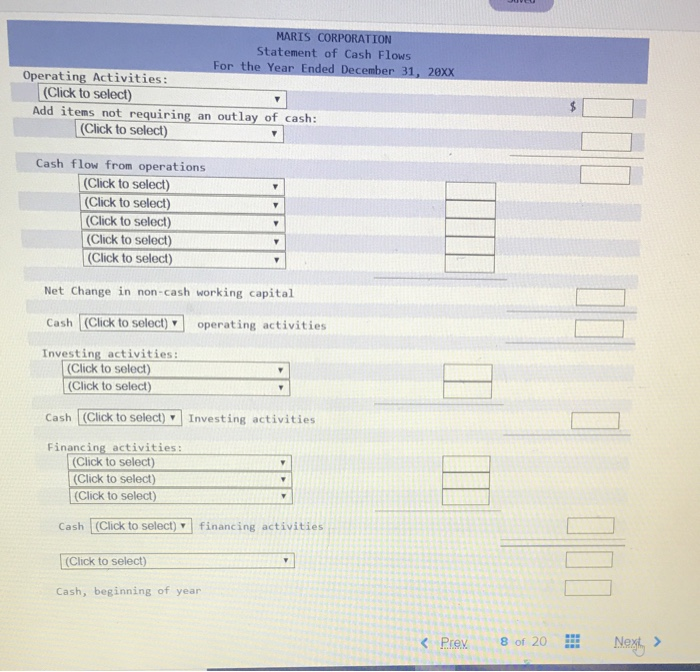
Given is the Income Statement for the year ended December 31, 20XX, Statement of Retained Earnings for the year ended December 31, 20XX and Comparative Balance Sheets for 20XW and 20XX of Maris Corporation Maris Corporation Income Statement Year Ended December 31, 20xx Sales Cost of goods sold $6,000,000 4,150,000 Gross profits Selling and administrative expense Amortization expense 1,850,000 760,000 280,000 Operating income Interest expense 810,000 55,000 Earnings before taxes Taxes 755,000 380,000 Earnings after taxes 375,000 Preferred stock dividends 30,000 Earnings available to comon shareholders $145,000 Shares outstanding Earnings per share 143,750 $2.40 Statement of Retained Earnings For the Year Ended December 31, 20XX Retained earnings, balance, January 1, 20XX Add: Earnings available to common shareholders, 20xx Deduct: Cash dividends declared and paid in 20XX Retained earnings, balance, December 31, 20XX $920,000 345,000 150,00 $1,115,000 Statement of Retained Earnings For the Year Ended December 31, 20xx Retained earnings, balance, January 1, 20xx Add: Earnings available to common shareholders, 20xx Deduct: Cash dividends declared and paid in 20xx Retained earnings, balance, December 31, 29xx $920,000 345,000 150,000 $1,115,000 Comparative Balance Sheets For 20XX and 20XW December 31, 20xx December 31, 20XW Assets Current assets: Cash Accounts receivable (net) Inventory Prepaid expenses $120,000 570,000 540,000 29,000 $103,000 558,000 505,000 58,000 1,259,000 120,000 1,224,000 125,000 2,600,000 1,053,000 2,000,000 773,000 Total current assets Investments (long-term securities) Plant and equipment Less: Accumulated depreciation Net plant and equipment Total assets 1,547,000 1,227,000 $2,926,000 $2,576,000 Liabilities and Shareholders' Equity Current liabilities: Accounts payable Notes payable Accrued expenses $425,000 500,000 56,000 $352,000 500,000 64,000 981,000 916,000 Total current liabilities antarilor 1 Summer 2020 Saved For 20xx and 20XW December 31, 20xx December 31, 20XW $120,000 570,000 540,000 29,000 $103,000 558,000 505,000 58,000 1,259,000 120,000 1,224,000 125,000 2,600,000 1,053,000 2,000,000 773,000 Assets Current assets: Cash Accounts receivable (net) Inventory Prepaid expenses Total current assets Investments (long-term securities) Plant and equipment Less: Accumulated depreciation Net plant and equipment Total assets Liabilities and Shareholders' Equity Current liabilities: Accounts payable Notes payable Accrued expenses Total current liabilities Long term liabilities: Bonds payable, 20XY 1,547,000 1,227,000 $2,926,000 $2,576,000 $425,000 500,000 56,000 $352,000 500,000 64,000 981,000 916,000 190,000 100,000 1,016,000 Total liabilities Shareholders equity! Preferred stock Common stock Retained earnings 1,171,000 140,000 500,000 1,115,000 140,000 500,000 920,000 1,755,000 1,560,000 Total shareholders equity $2,926,000 $2,576,000 Total liabilities and shareholders' equity MARIS CORPORATION Statement of Cash Flows For the Year Ended December 31, 20XX Operating Activities: (Click to select) Add items not requiring an outlay of cash: (Click to select) Cash flow from operations (Click to select) (Click to select) (Click to select) (Click to select) (Click to select) 7 Net Change in non-cash working capital Cash (Click to select) operating activities Investing activities: (Click to select) (Click to select) Cash (Click to select) Investing activities Financing activities: (Click to select) (Click to select) (Click to select) Cash (Click to select) financing activities (Click to select) Cash, beginning of year


