Answered step by step
Verified Expert Solution
Question
1 Approved Answer
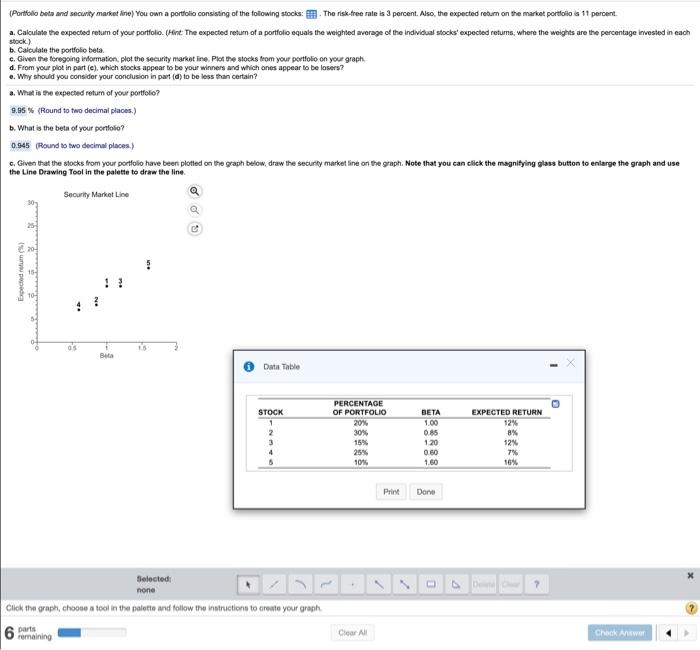
Given that the stocks from your portfolio have been plotted on the graph below, draw the security market line on the graph. (Portfolio bela and
Given that the stocks from your portfolio have been plotted on the graph below, draw the security market line on the graph. 
(Portfolio bela and security market ine) You own a portfolio consisting of the following stocks: The risk-free rate is 3 percent. Also, the expected retum on the market portfolio a 11 percent. 2. Calculate the expected retum of your portfolio. (Hint: The expected return of a portfolio equals the weighted average of the Individual stocks' expected retums, where the weights are the percentage invested in each stock) b. Calculate the portfolio beta c. Given the foregoing information, plot the security market line. Plot the stocks from your portfolio on your graph, d. From your plot in part (c) which stocks appear to be your winners and which ones appear to be losers? Why should you consider your conclusion in part (d) to be less than certain? a. What is the expected retum of your portfolio? 9.95% (Round to two decimal places) b. What is the beta of your portfolio? 0.945 Round to two decimal places) 6. Given that the stocks from your portfolio have been plotted on the graph below, draw the security market ine on the graph. Note that you can click the magnifying glass button to enlarge the graph and use the Line Drawing Tool in the palette to draw the line Security Market Line 20 Expected return 15 Beta Data Table STOCK 1 2 3 PERCENTAGE OF PORTFOLIO 20% 30% 15% 25% 10% BETA 1.00 0.85 120 0.60 1.60 EXPECTED RETURN 12% 8% 12% 7% 16% 8 Print Done Selected none Click the graph, choose a tool in the palette and follow the instruction to create your graph 6 remaining Clear All Check Answer (Portfolio bela and security market ine) You own a portfolio consisting of the following stocks: The risk-free rate is 3 percent. Also, the expected retum on the market portfolio a 11 percent. 2. Calculate the expected retum of your portfolio. (Hint: The expected return of a portfolio equals the weighted average of the Individual stocks' expected retums, where the weights are the percentage invested in each stock) b. Calculate the portfolio beta c. Given the foregoing information, plot the security market line. Plot the stocks from your portfolio on your graph, d. From your plot in part (c) which stocks appear to be your winners and which ones appear to be losers? Why should you consider your conclusion in part (d) to be less than certain? a. What is the expected retum of your portfolio? 9.95% (Round to two decimal places) b. What is the beta of your portfolio? 0.945 Round to two decimal places) 6. Given that the stocks from your portfolio have been plotted on the graph below, draw the security market ine on the graph. Note that you can click the magnifying glass button to enlarge the graph and use the Line Drawing Tool in the palette to draw the line Security Market Line 20 Expected return 15 Beta Data Table STOCK 1 2 3 PERCENTAGE OF PORTFOLIO 20% 30% 15% 25% 10% BETA 1.00 0.85 120 0.60 1.60 EXPECTED RETURN 12% 8% 12% 7% 16% 8 Print Done Selected none Click the graph, choose a tool in the palette and follow the instruction to create your graph 6 remaining Clear All Check 
Step by Step Solution
There are 3 Steps involved in it
Step: 1

Get Instant Access to Expert-Tailored Solutions
See step-by-step solutions with expert insights and AI powered tools for academic success
Step: 2

Step: 3

Ace Your Homework with AI
Get the answers you need in no time with our AI-driven, step-by-step assistance
Get Started


