

Answered step by step
Verified Expert Solution
Question
1 Approved Answer
Given the above chart for Kellog, Discuss how the stock for Kellog Co is trending. Explain why the stock is in either an uptrend or
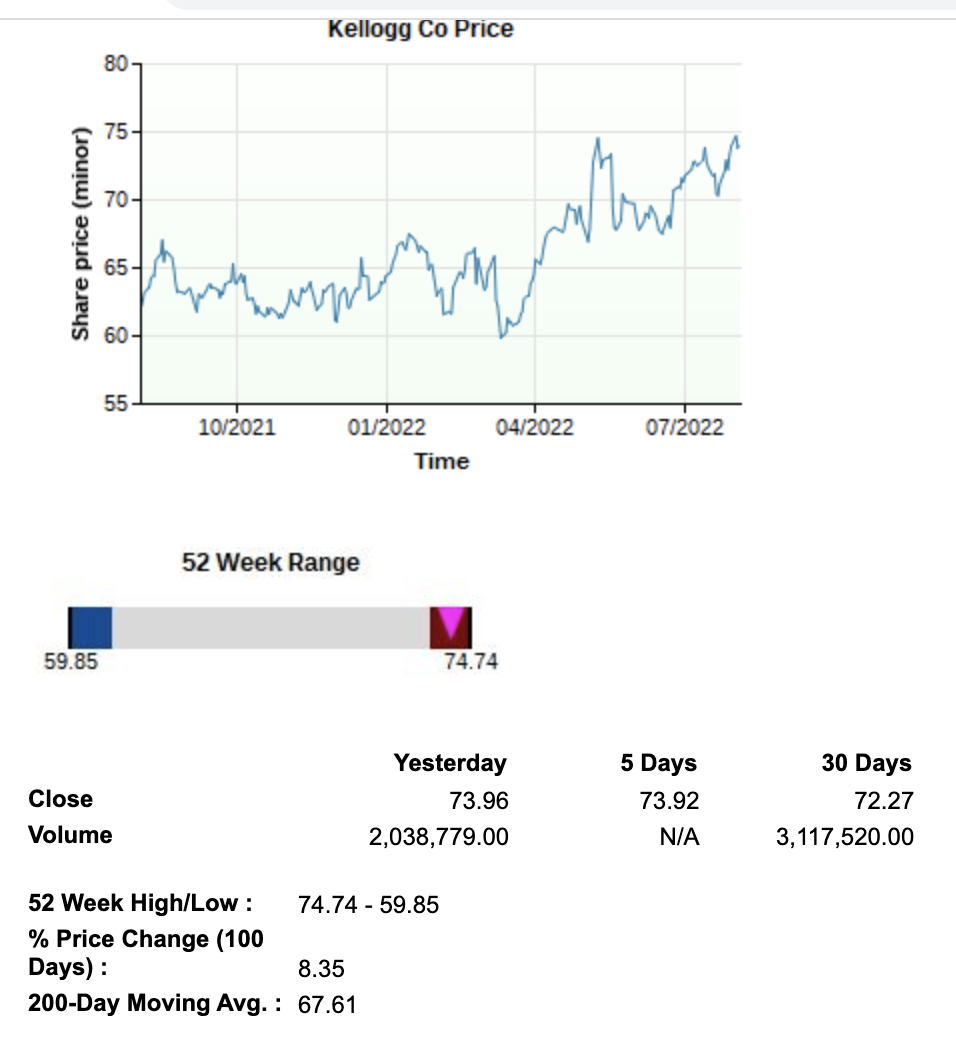
Given the above chart for Kellog,
- Discuss how the stock for Kellog Co is trending. Explain why the stock is in either an uptrend or downtrend and will you recommend this stock to a friend? why or why not. support your answers with a financial analysis base on the chart.
Step by Step Solution
There are 3 Steps involved in it
Step: 1

Get Instant Access to Expert-Tailored Solutions
See step-by-step solutions with expert insights and AI powered tools for academic success
Step: 2

Step: 3
Ace Your Homework with AI
Get the answers you need in no time with our AI-driven, step-by-step assistance
Get Started
The Mining Valuation Handbook Mining And Energy Valuation For Investors And Management
Authors: Victor Rudenno
4th Edition
0730377075, 978-0730377078