Answered step by step
Verified Expert Solution
Question
1 Approved Answer
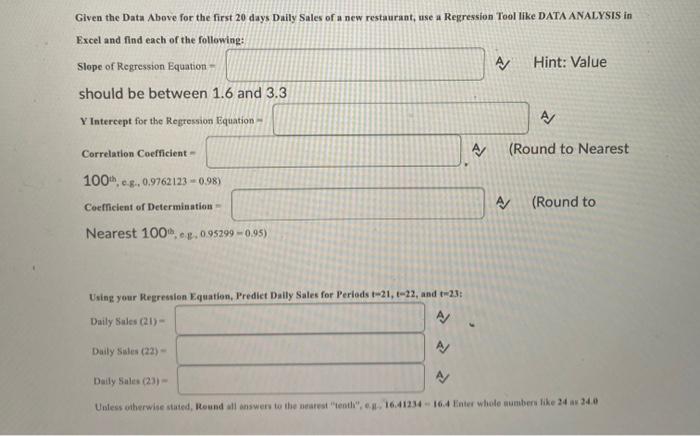
Given the Data Above for the first 20 days Daily Sales of a new restaurant, use a Regression Tool like DATA ANALYSIS in Excel


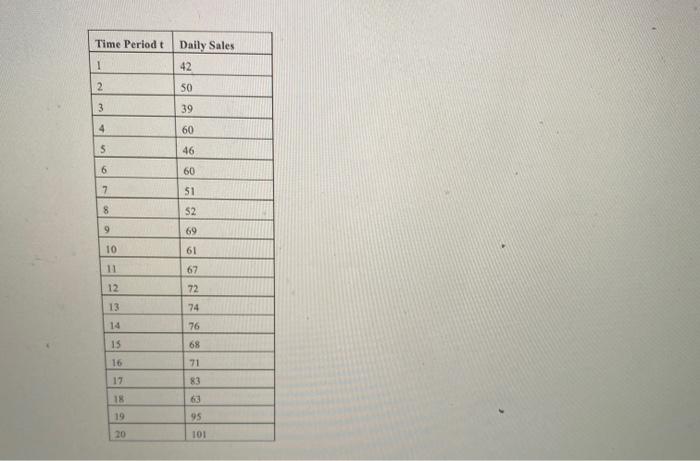
Given the Data Above for the first 20 days Daily Sales of a new restaurant, use a Regression Tool like DATA ANALYSIS in Excel and find each of the following: Slope of Regression Equation- Hint: Value should be between 1.6 and 3.3 Y Intercept for the Regression Equation Correlation Coefficient (Round to Nearest 100h, eg, 0.9762123-0.98) (Round to Coefficient of Determination - Nearest 100, eg, 095299 - 0.95) Using your Regression Equation, Prediet Dally Sales for Perlods t-21, t-22, and t-23: Daily Sales (21)- Daily Sales (22)- Daily Sales (23)- Unless otherwise stated, Reund all answers to the nearest "tenth", eg, 16.41234- 16.4 Enter whole aumbers like 24 as 24.0 Time Period t Daily Sales 42 2 50 3. 39 4 60 46 60 7. 51 52 9. 69 10 61 11 67 12 72 13 74 14 76 15 68 16 71 17 83 18 63 19 95 20 101
Step by Step Solution
★★★★★
3.54 Rating (168 Votes )
There are 3 Steps involved in it
Step: 1
A D G H K L N 1 Time Periodt Daily Sales 2 1 60 SUMMARY OUTPUT ...
Get Instant Access to Expert-Tailored Solutions
See step-by-step solutions with expert insights and AI powered tools for academic success
Step: 2

Step: 3

Ace Your Homework with AI
Get the answers you need in no time with our AI-driven, step-by-step assistance
Get Started


