Given the data from Amazon below, provide a 2 year projected statement of their forecasted Income statement.
As much detail as possible is appreciated.
Edit:
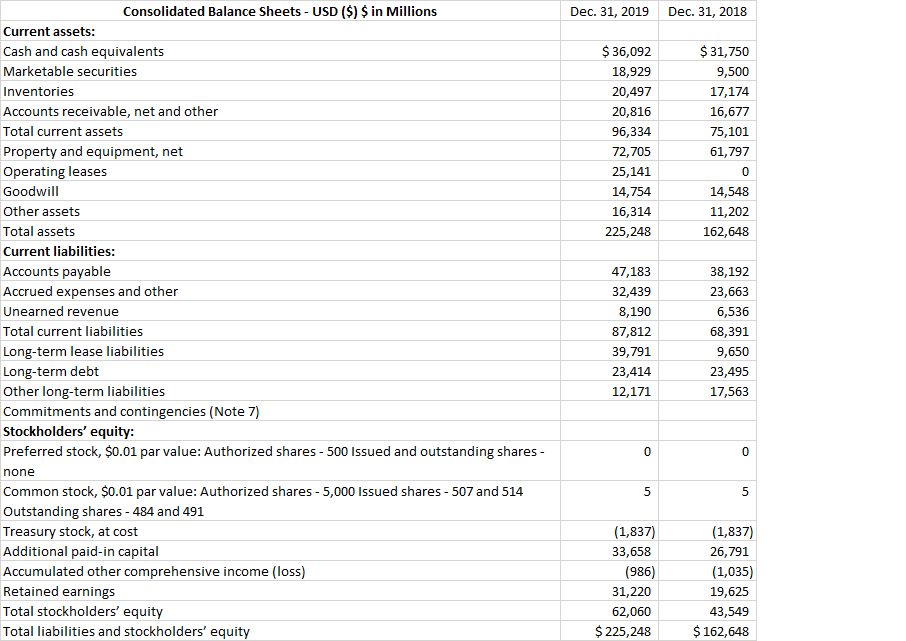
Including the balance sheet below
Edit 2:
Adding Operations
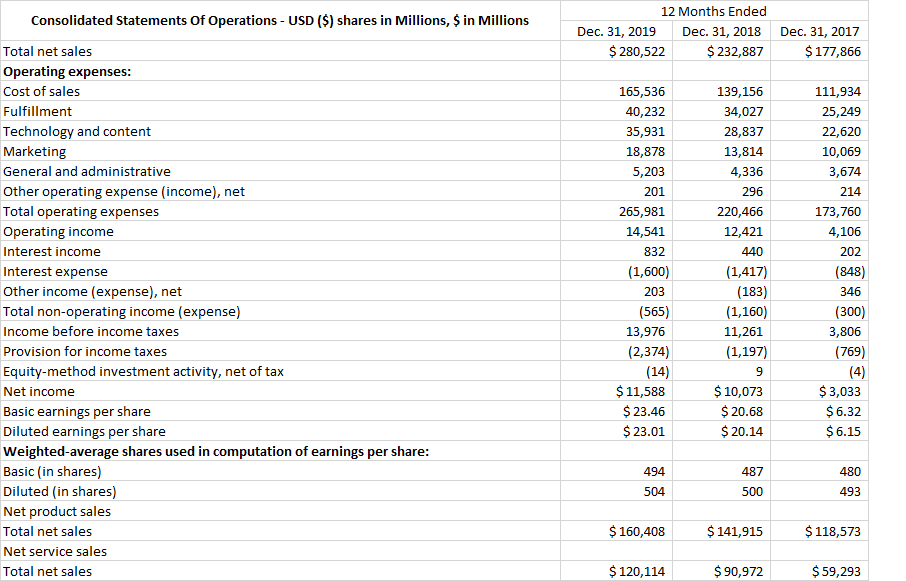
Consolidated Statements of Operations - USD ($) shares in Millions, $ in Millions 12 Months Ended Dec. 31, 2019 Dec. 31, 2018 $ 280,522 $ 232,887 Dec. 31, 2017 $ 177,866 111,934 25,249 22,620 10,069 3,674 214 173,760 4,106 202 Total net sales Operating expenses: Cost of sales Fulfillment Technology and content Marketing General and administrative Other operating expense (income), net Total operating expenses Operating income Interest income Interest expense Other income (expense), net Total non-operating income (expense) Income before income taxes Provision for income taxes Equity-method investment activity, net of tax Net income Basic earnings per share Diluted earnings per share Weighted average shares used in computation of earnings per share: Basic (in shares) Diluted in shares) Net product sales Total net sales Net service sales Total net sales 165,536 40,232 35,931 18,878 5,203 201 265,981 14,541 832 (1,600) 203 (565) 13,976 (2,374) (14) $ 11,588 $ 23.46 $ 23.01 139,156 34,027 28,837 13,814 4,336 296 220,466 12,421 440 (1,417) (183) (1,160) 11,261 (1,197) (848) 346 (300) 3,806 (769) (4) $ 10,073 $20.68 $ 20.14 $ 3,033 $6.32 $6.15 494 504 487 500 480 493 $ 160,408 $ 141,915 $ 118,573 $ 120,114 $ 90,972 $ 59,293 Dec 31, 2019 Dec. 31, 2018 $36,092 18,929 20,497 20,816 96,334 72,705 25,141 14,754 16,314 225,248 $ 31,750 9,500 17,174 16,677 75,101 61,797 14,548 11,202 162,648 Consolidated Balance Sheets - USD ($) $ in Millions Current assets: Cash and cash equivalents Marketable securities Inventories Accounts receivable, net and other Total current assets Property and equipment, net Operating leases Goodwill Other assets Total assets Current liabilities: Accounts payable Accrued expenses and other Unearned revenue Total current liabilities Long-term lease liabilities Long-term debt Other long-term liabilities Commitments and contingencies (Note 7) Stockholders' equity: Preferred stock, $0.01 par value: Authorized shares - 500 Issued and outstanding shares - none Common stock, $0.01 par value: Authorized shares - 5,000 Issued shares - 507 and 514 Outstanding shares - 484 and 491 Treasury stock, at cost Additional paid-in capital Accumulated other comprehensive income (loss) Retained earnings Total stockholders' equity Total liabilities and stockholders' equity 47,183 32,439 8,190 87,812 39,791 23,414 12,171 38,192 23,663 6,536 68,391 9,650 23,495 17,563 (1,837) 33,658 (986) 31,220 62,060 $ 225,248 (1,837) 26,791 (1,035) 19,625 43,549 $ 162,648 Consolidated Statements of Operations - USD ($) shares in Millions, $ in Millions 12 Months Ended Dec. 31, 2019 Dec. 31, 2018 $ 280,522 $ 232,887 Dec. 31, 2017 $ 177,866 111,934 25,249 22,620 10,069 3,674 214 173,760 4,106 202 Total net sales Operating expenses: Cost of sales Fulfillment Technology and content Marketing General and administrative Other operating expense (income), net Total operating expenses Operating income Interest income Interest expense Other income (expense), net Total non-operating income (expense) Income before income taxes Provision for income taxes Equity-method investment activity, net of tax Net income Basic earnings per share Diluted earnings per share Weighted average shares used in computation of earnings per share: Basic (in shares) Diluted in shares) Net product sales Total net sales Net service sales Total net sales 165,536 40,232 35,931 18,878 5,203 201 265,981 14,541 832 (1,600) 203 (565) 13,976 (2,374) (14) $ 11,588 $ 23.46 $ 23.01 139,156 34,027 28,837 13,814 4,336 296 220,466 12,421 440 (1,417) (183) (1,160) 11,261 (1,197) (848) 346 (300) 3,806 (769) (4) $ 10,073 $20.68 $ 20.14 $ 3,033 $6.32 $6.15 494 504 487 500 480 493 $ 160,408 $ 141,915 $ 118,573 $ 120,114 $ 90,972 $ 59,293 Dec 31, 2019 Dec. 31, 2018 $36,092 18,929 20,497 20,816 96,334 72,705 25,141 14,754 16,314 225,248 $ 31,750 9,500 17,174 16,677 75,101 61,797 14,548 11,202 162,648 Consolidated Balance Sheets - USD ($) $ in Millions Current assets: Cash and cash equivalents Marketable securities Inventories Accounts receivable, net and other Total current assets Property and equipment, net Operating leases Goodwill Other assets Total assets Current liabilities: Accounts payable Accrued expenses and other Unearned revenue Total current liabilities Long-term lease liabilities Long-term debt Other long-term liabilities Commitments and contingencies (Note 7) Stockholders' equity: Preferred stock, $0.01 par value: Authorized shares - 500 Issued and outstanding shares - none Common stock, $0.01 par value: Authorized shares - 5,000 Issued shares - 507 and 514 Outstanding shares - 484 and 491 Treasury stock, at cost Additional paid-in capital Accumulated other comprehensive income (loss) Retained earnings Total stockholders' equity Total liabilities and stockholders' equity 47,183 32,439 8,190 87,812 39,791 23,414 12,171 38,192 23,663 6,536 68,391 9,650 23,495 17,563 (1,837) 33,658 (986) 31,220 62,060 $ 225,248 (1,837) 26,791 (1,035) 19,625 43,549 $ 162,648