

Answered step by step
Verified Expert Solution
Question
1 Approved Answer
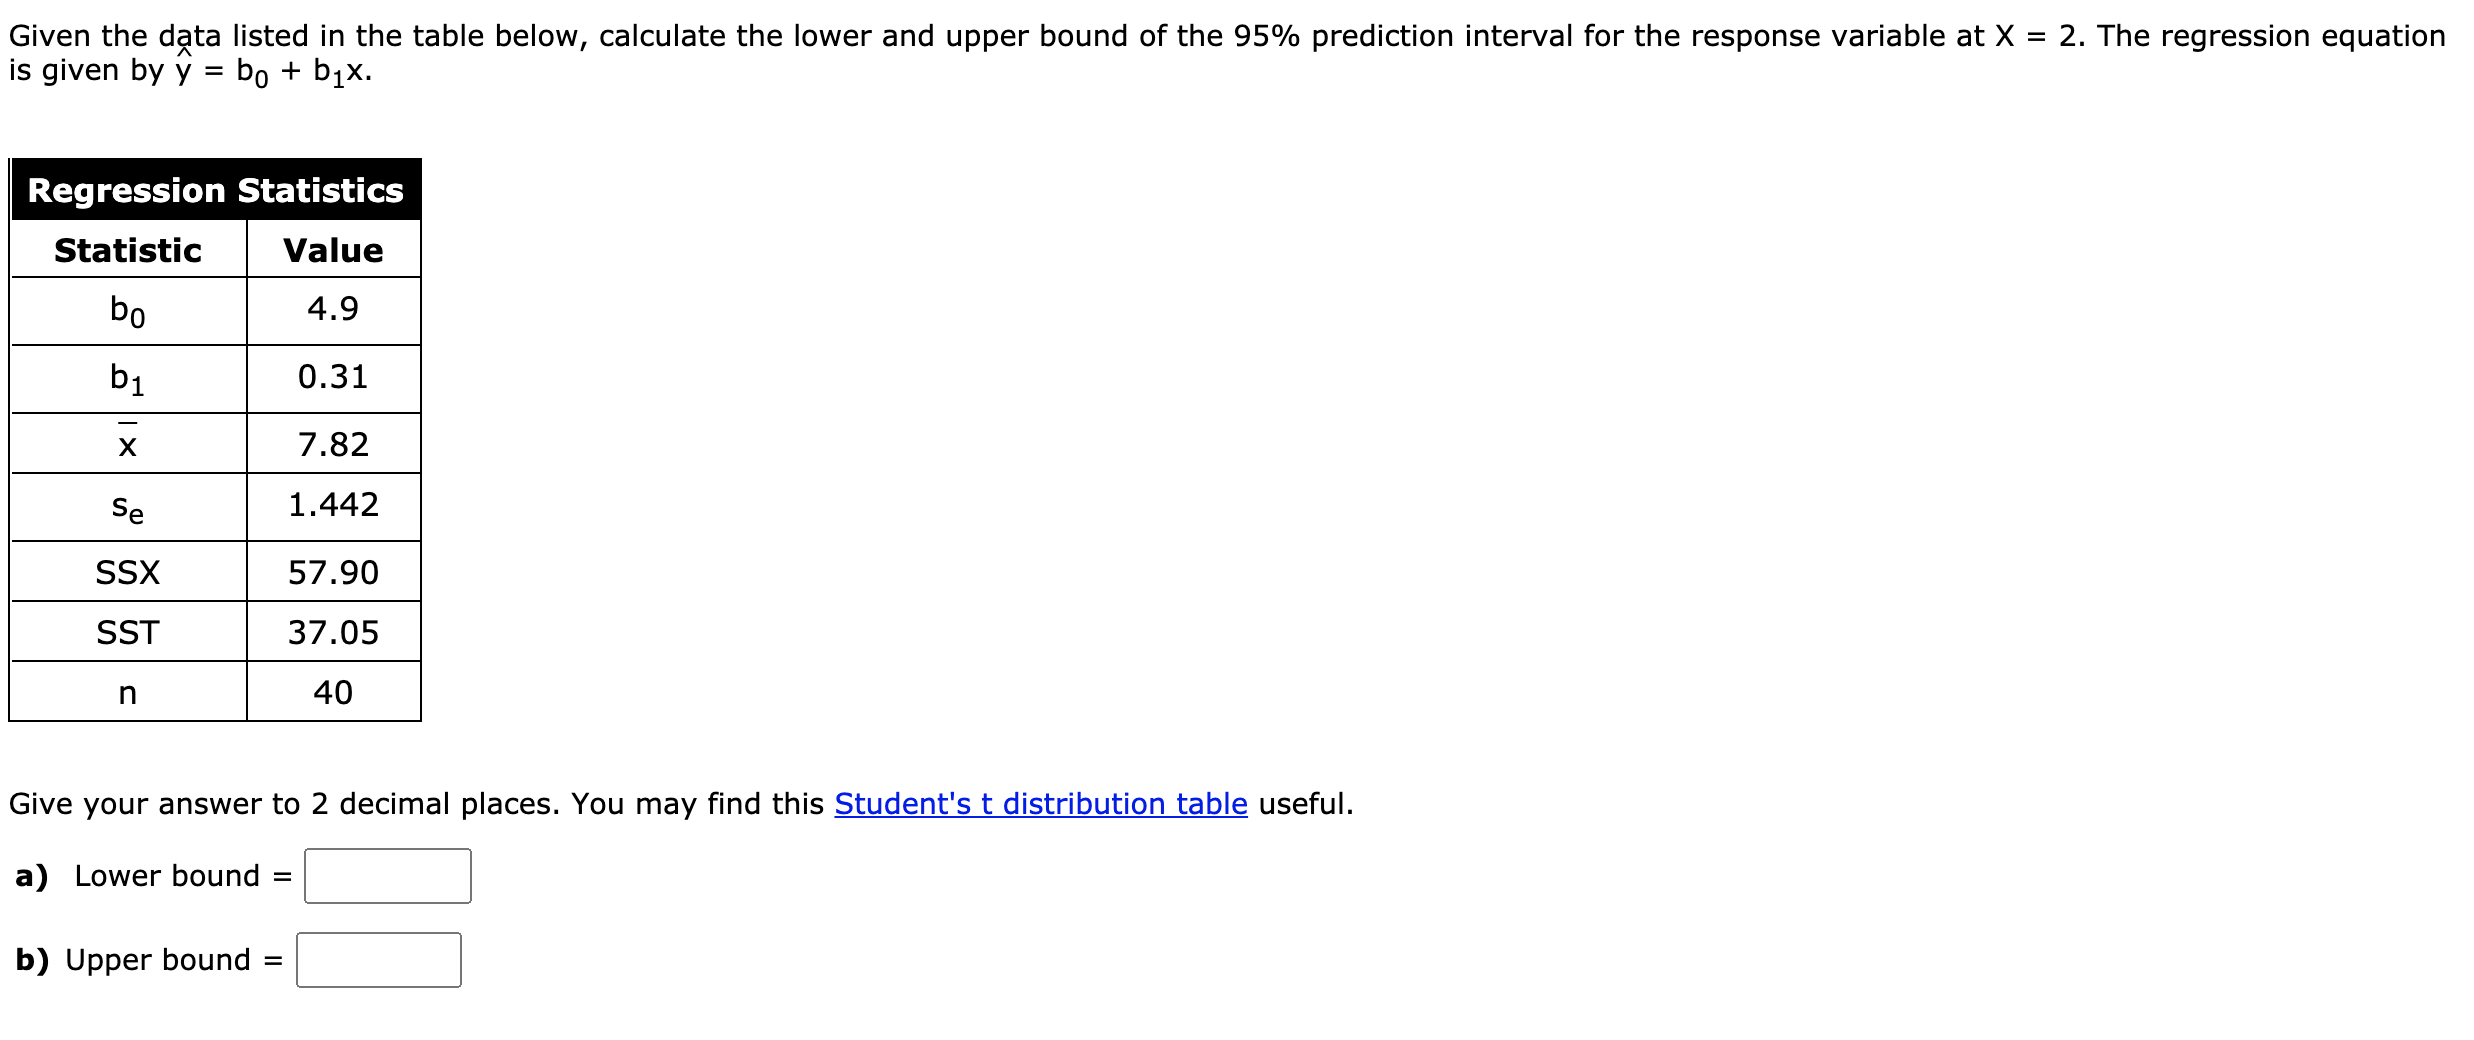
Given the data listed in the table below, calculate the lower and upper bound of the 95% prediction interval for the response variable at X
Step by Step Solution
There are 3 Steps involved in it
Step: 1

Get Instant Access to Expert-Tailored Solutions
See step-by-step solutions with expert insights and AI powered tools for academic success
Step: 2

Step: 3
Ace Your Homework with AI
Get the answers you need in no time with our AI-driven, step-by-step assistance
Get Started
Intermediate Algebra With Trigonometry
Authors: Charles P McKeague
1st Edition
1483218759, 9781483218755