Answered step by step
Verified Expert Solution
Question
1 Approved Answer
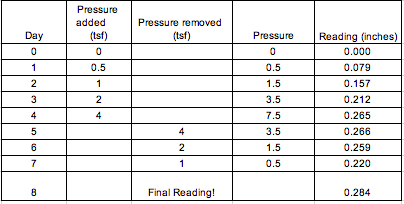
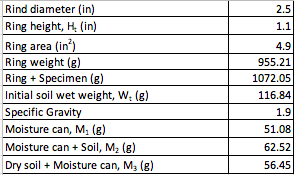
Given the data: Make a table showing axial strain vs applied strain. Make a graph with the values from the table (please show steps) Pressure


Given the data:
Make a table showing axial strain vs applied strain.
Make a graph with the values from the table
(please show steps)
Pressure removed (tsf) Day 0 Pressure added (ts) 0 0.5 1 2 4 1 2 3 Pressure 0 0.5 1.5 3.5 7.5 3.5 1.5 0.5 Reading (inches) 0.000 0.079 0.157 0.212 0.265 0.266 0.259 0.220 4 5 4 00 N 7 1 B Final Reading! 0.284 2.5 1.1 Rind diameter (in) Ring height, H. (in) Ring area (in) Ring weight (g) Ring + Specimen (e) Initial soil wet weight, W. (e) Specific Gravity Moisture can, M. (6) Moisture can + Soil, M2 (e) Dry soil + Moisture can, M3 (e) 4.9 955.21 1072.05 116.84 1.9 51.08 62.52 56.45 Pressure removed (tsf) Day 0 Pressure added (ts) 0 0.5 1 2 4 1 2 3 Pressure 0 0.5 1.5 3.5 7.5 3.5 1.5 0.5 Reading (inches) 0.000 0.079 0.157 0.212 0.265 0.266 0.259 0.220 4 5 4 00 N 7 1 B Final Reading! 0.284 2.5 1.1 Rind diameter (in) Ring height, H. (in) Ring area (in) Ring weight (g) Ring + Specimen (e) Initial soil wet weight, W. (e) Specific Gravity Moisture can, M. (6) Moisture can + Soil, M2 (e) Dry soil + Moisture can, M3 (e) 4.9 955.21 1072.05 116.84 1.9 51.08 62.52 56.45Step by Step Solution
There are 3 Steps involved in it
Step: 1

Get Instant Access to Expert-Tailored Solutions
See step-by-step solutions with expert insights and AI powered tools for academic success
Step: 2

Step: 3

Ace Your Homework with AI
Get the answers you need in no time with our AI-driven, step-by-step assistance
Get Started


