

Answered step by step
Verified Expert Solution
Question
1 Approved Answer
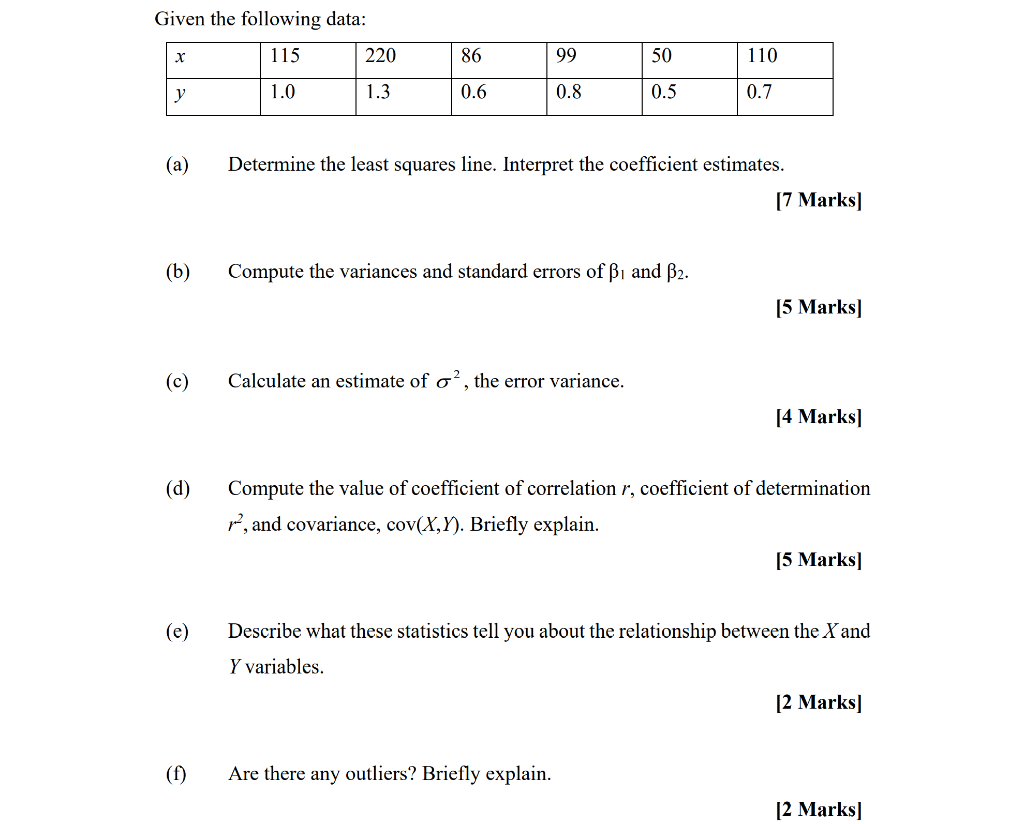
Given the following data: 115 220 86 99 50 110 y 1.0 1.3 0.6 0.8 0.5 0.7 (a) Determine the least squares line. Interpret the
Step by Step Solution
There are 3 Steps involved in it
Step: 1

Get Instant Access to Expert-Tailored Solutions
See step-by-step solutions with expert insights and AI powered tools for academic success
Step: 2

Step: 3
Ace Your Homework with AI
Get the answers you need in no time with our AI-driven, step-by-step assistance
Get Started
Principles Of Econometrics
Authors: R Hill
4th Edition
1118136969, 9781118136966