15. Given the following data, use Excel to construct a least squares regression model that develops a relation between the number of games lost,

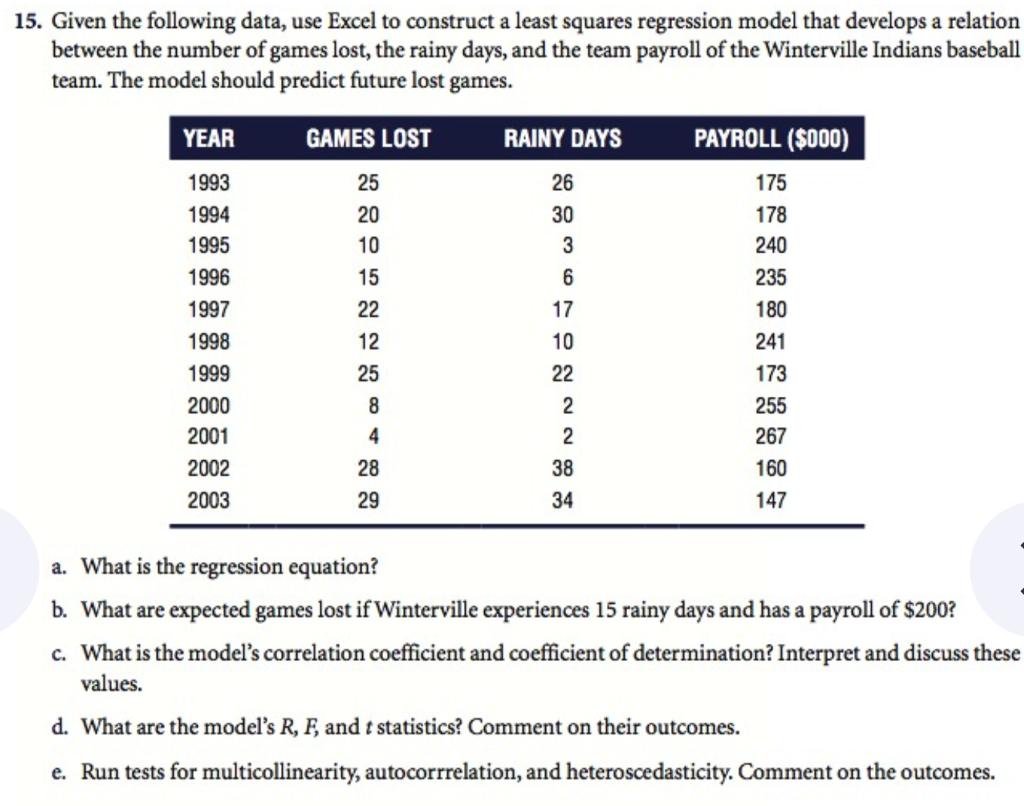
15. Given the following data, use Excel to construct a least squares regression model that develops a relation between the number of games lost, the rainy days, and the team payroll of the Winterville Indians baseball team. The model should predict future lost games. YEAR GAMES LOST RAINY DAYS PAYROLL ($O00) 1993 25 26 175 1994 20 30 178 1995 10 240 1996 15 235 1997 22 17 180 1998 12 10 241 1999 25 22 173 2000 8 255 2001 4 2 267 2002 28 38 160 2003 29 34 147 a. What is the regression equation? b. What are expected games lost if Winterville experiences 15 rainy days and has a payroll of $200? c. What is the model's correlation coefficient and coefficient of determination? Interpret and discuss these values. d. What are the model's R, F, and t statistics? Comment on their outcomes. e. Run tests for multicollinearity, autocorrrelation, and heteroscedasticity. Comment on the outcomes.
Step by Step Solution
3.33 Rating (156 Votes )
There are 3 Steps involved in it
Step: 1

See step-by-step solutions with expert insights and AI powered tools for academic success
Step: 2

Step: 3

Ace Your Homework with AI
Get the answers you need in no time with our AI-driven, step-by-step assistance
Get Started


