

Answered step by step
Verified Expert Solution
Question
1 Approved Answer
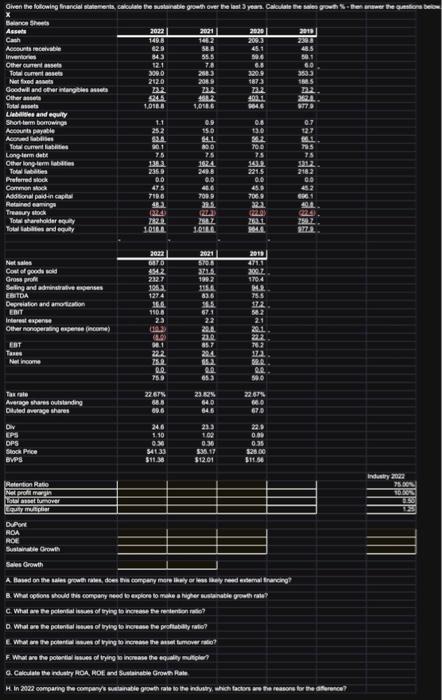
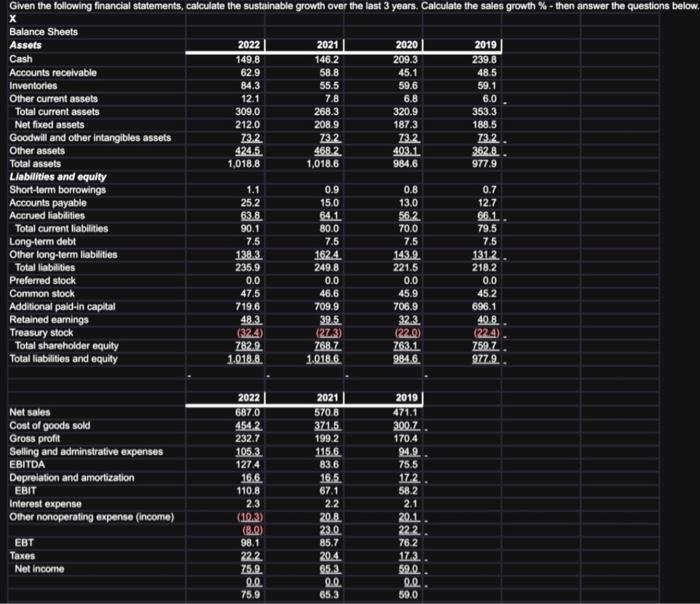
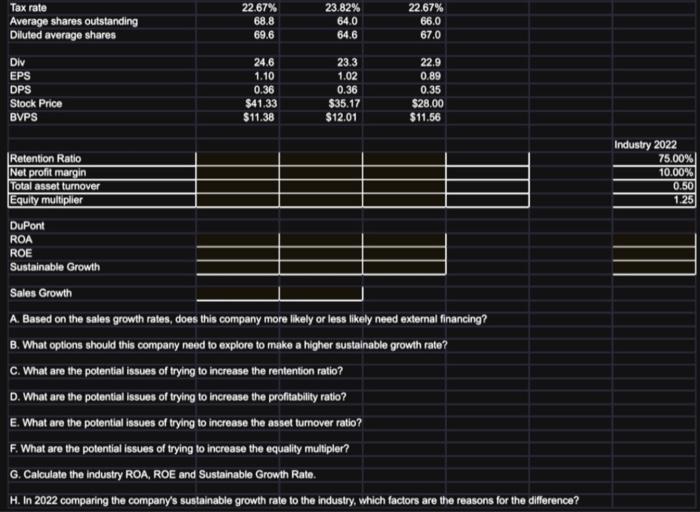
Given the following financial statements, calculate the sustainable growth over the last 3 years. Calculate the sales growth % - then answer the questions below.
Given the following financial statements, calculate the sustainable growth over the last 3 years. Calculate the sales growth % - then answer the questions below. X Balance Sheets Assets Cash Accounts receivable Inventories Other current assets Total current assets Net fixed assets Goodwill and other intangibles assets Other assets Total assets Liabilities and equity Short-term borrowings Accounts payable Accrued liabilities Total current liabilities Long-term debt Other long-term liabilities Total liabilities Preferred stock Common stock Additional paid-in capital Retained earnings Treasury stock Total shareholder equity Total liabilities and equity Net sales Cost of goods sold Gross profit Selling and adminstrative expenses EBITDA Depreiation and amortization EBIT Interest expense Other nonoperating expense (income) EBT Taxes Net income Tax rate Average shares outstanding Diluted average shares Div EPS DPS Stock Price BVPS Retention Ratio Net profit margin Total asset turnover Equity multiplier DuPont ROA ROE Sustainable Growth Sales Growth 2022 149.8 62.9 84.3 12.1 309.0 212.0 73.2 424.5 1,018.8 1.1 25.2 63.8 90.1 7.5 138.3 235.9 0.0 47.5 719.6 48.3 (32.4) 782.9 1,018.8 2022 687.0 454.2 232.7 105.3 127.4 16.6 110.8 2.3 (10.3) (8.0) 98.1 22.2 75.9 0.0 75.9 22.67% 68.8 69.6 24.6 1.10 0.36 $41.33 $11.38 2021 | 146.2 58.8 55.5 7.8 268.3 208.9 73.2 468.2 1,018.6 0.9 15.0 64.1 80.0 7.5 162.4 249.8 0.0 46.6 709.9 39.5 (27.3) 768.7 1,018.6 2021 570.8 371.5 199.2 115.6 83.6 16.5 67.1 2.2 20.8 23.0 85.7 20.4 65.3 0.0 65.3 23.82% 64.0 64.6 23.3 1.02 0.36 $35.17 $12.01 2020 209.3 45.1 59.6 6.8 320.9 187.3 73.2 403.1 984.6 0.8 13.0 56.2 70.0 7.5 143.9 221.5 0.0 45.9 706.9 32.3 (22.0) 763.1 984.6 2019 471.1 300.7 170.4 94.9 75.5 17.2 58.2 2.1 20.1 22.2 76.2 17.3 59.0 0.0 59.0 22.67% 66.0 67.0 22.9 0.89 0.35 $28.00 $11.56 2019 239.8 48.5 59.1 6.0 353.3 188.5 73.2 362.8 977.9 0.7 12.7 66.1 79.5 7.5 131.2 218.2 0.0 45.2 696.1 40.8 (22.4) 759.7 977.9 A. Based on the sales growth rates, does this company more likely or less likely need external financing? B. What options should this company need to explore to make a higher sustainable growth rate? C. What are the potential issues of trying to increase the rentention ratio? D. What are the potential issues of trying to increase the profitability ratio? E. What are the potential issues of trying to increase the asset turnover ratio? F. What are the potential issues of trying to increase the equality multipler? G. Calculate the industry ROA, ROE and Sustainable Growth Rate. H. In 2022 comparing the company's sustainable growth rate to the industry, which factors are the reasons for the difference? Industry 2022 75.00% 10.00% 0.50 1.25
Step by Step Solution
There are 3 Steps involved in it
Step: 1

Get Instant Access to Expert-Tailored Solutions
See step-by-step solutions with expert insights and AI powered tools for academic success
Step: 2

Step: 3
Ace Your Homework with AI
Get the answers you need in no time with our AI-driven, step-by-step assistance
Get Started
Payroll Fraud Detection And Prevention Audit Expert System
Authors: Titus Oniyilo
1st Edition
136564345X, 978-1365643453