

Question
Given the following information, use Excels Regression tool and scatter plot tool to: (No need to show the regression and scatter plot just answer the
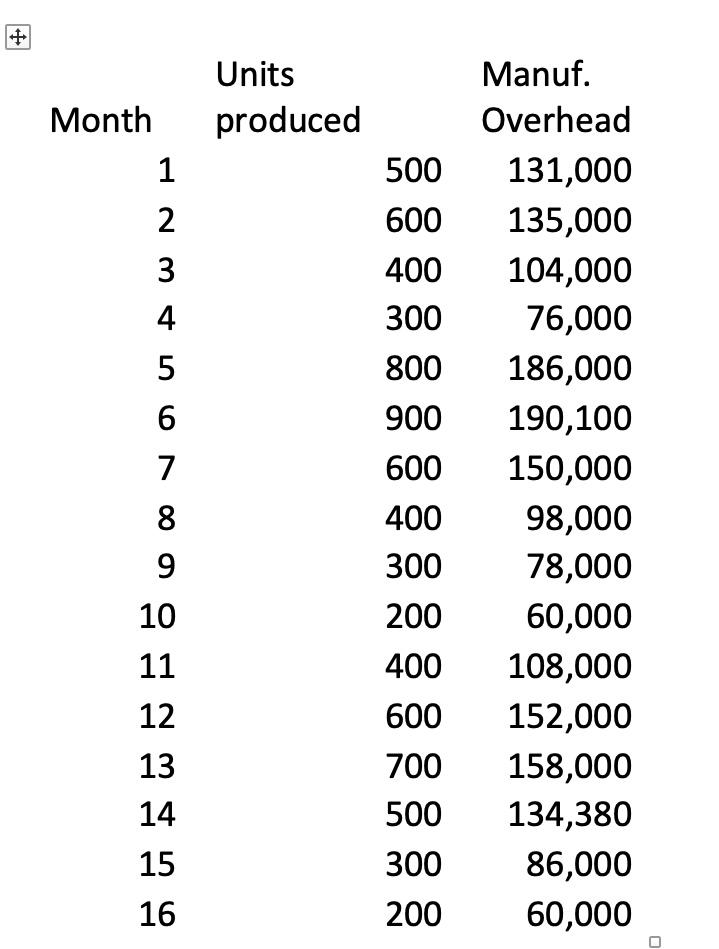 Given the following information, use Excels Regression tool and scatter plot tool to: (No need to show the regression and scatter plot just answer the questions.) (c) What is the 95% prediction interval for the true overhead when the number of units produced is 1,000? Month Units produced Manuf. Overhead 1 500 131,000 2 600 135,000 3 400 104,000 4 300 76,000 5 800 186,000 6 900 190,100 7 600 150,000 8 400 98,000 9 300 78,000 10 200 60,000 11 400 108,000 12 600 152,000 13 700 158,000 14 500 134,380 15 300 86,000 16 200 60,000
Step by Step Solution
There are 3 Steps involved in it
Step: 1

Get Instant Access to Expert-Tailored Solutions
See step-by-step solutions with expert insights and AI powered tools for academic success
Step: 2

Step: 3
Ace Your Homework with AI
Get the answers you need in no time with our AI-driven, step-by-step assistance
Get Started
Principles Of Cost Accounting
Authors: Edward J. Vanderbeck
15th Edition
978-0840037039, 0840037031