Answered step by step
Verified Expert Solution
Question
1 Approved Answer
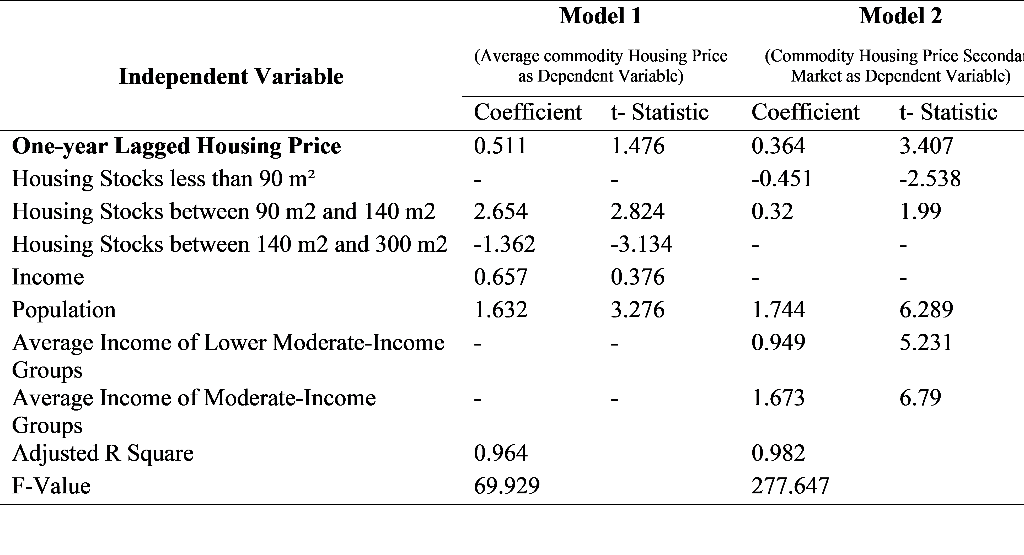
Given the following models and corresponding OLS output, where Commodity Housing Price (P) One Year Lagged Housing Price (P t-1 ) Commodity Housing Price in
Given the following models and corresponding OLS output,


where
- Commodity Housing Price (P)
- One Year Lagged Housing Price (Pt-1)
- Commodity Housing Price in the Secondary Housing Market (Ps)
- Population (N)
- Housing Stocks less than 90 m2 (LESS90)
- Housing Stocks between 90 m2 and 140 m2 (90TO140)
- Housing Stocks between 140 m2 and 300 m2 (140TO300)
- Average Disposable Income (Y)
- Average Disposable Income of Low-Income Groups (LIG)
- Average Disposable Income of Lower Moderate-Income Groups (LMIG)
- Average Disposable Income of Moderate-Income Groups (MIG)

interpret the OLS output results and coefficients commenting on the signs of the coefficients (do they make economic sense?), and the statistical significance of the estimated coefficients and the model as a whole.
what type of data is this? does the model have any obvious potential econometric problems?
Ln(PST) = 30+B1Ln(PSt-1)+32Ln(LES S90t) +33Ln(90T0140t) + B4Ln(Nt) + 35Ln(LMIGt) + B6Ln(MIGt) + Model 1 Model 2 (Commodity Housing Price Scconda Market as Dependent Variable) Coefficient t- Statistic 0.364 3.407 -0.451 -2.538 0.32 1.99 (Average commodity Housing Price Independent Variable as Dependent Variable) Coefficient t- Statistic One-year Lagged Housing Price 0.511 1,476 Housing Stocks less than 90 m Housing Stocks between 90 m2 and 140 m2 2.654 2.824 Housing Stocks between 140 m2 and 300 m2 -1.362 -3.134 Income 0.657 0.376 Population 1.632 3.276 Average Income of Lower Moderate-Income Groups Average Income of Moderate-Income Groups Adjusted R Square 0.964 F-Value 69.929 1.744 6.289 5.231 0.949 1.673 6.79 0.982 277.647 Ln(PST) = 30+B1Ln(PSt-1)+32Ln(LES S90t) +33Ln(90T0140t) + B4Ln(Nt) + 35Ln(LMIGt) + B6Ln(MIGt) + Model 1 Model 2 (Commodity Housing Price Scconda Market as Dependent Variable) Coefficient t- Statistic 0.364 3.407 -0.451 -2.538 0.32 1.99 (Average commodity Housing Price Independent Variable as Dependent Variable) Coefficient t- Statistic One-year Lagged Housing Price 0.511 1,476 Housing Stocks less than 90 m Housing Stocks between 90 m2 and 140 m2 2.654 2.824 Housing Stocks between 140 m2 and 300 m2 -1.362 -3.134 Income 0.657 0.376 Population 1.632 3.276 Average Income of Lower Moderate-Income Groups Average Income of Moderate-Income Groups Adjusted R Square 0.964 F-Value 69.929 1.744 6.289 5.231 0.949 1.673 6.79 0.982 277.647Step by Step Solution
There are 3 Steps involved in it
Step: 1

Get Instant Access to Expert-Tailored Solutions
See step-by-step solutions with expert insights and AI powered tools for academic success
Step: 2

Step: 3

Ace Your Homework with AI
Get the answers you need in no time with our AI-driven, step-by-step assistance
Get Started


