

Answered step by step
Verified Expert Solution
Question
1 Approved Answer
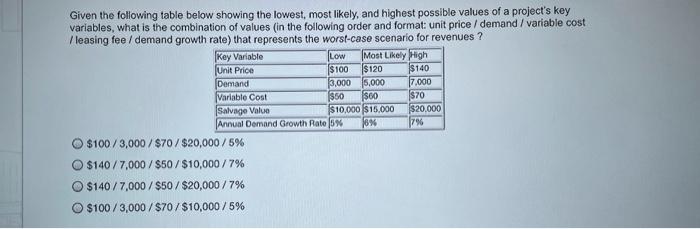
Given the following table below showing the lowest, most likely, and highest possible values of a project's key variables, what is the combination of values
Step by Step Solution
There are 3 Steps involved in it
Step: 1

Get Instant Access to Expert-Tailored Solutions
See step-by-step solutions with expert insights and AI powered tools for academic success
Step: 2

Step: 3
Ace Your Homework with AI
Get the answers you need in no time with our AI-driven, step-by-step assistance
Get Started
Financial Valuation Of Employee Stock Ownership Plan Shares
Authors: Larry R. Cook
1st Edition
0471678473, 978-0471678472