

Answered step by step
Verified Expert Solution
Question
1 Approved Answer
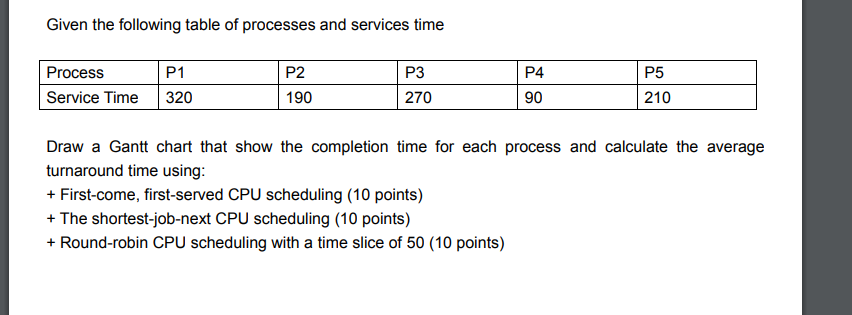
Given the following table of processes and services time P5 Process Service Time P1 320 P2 190 P3 270 P4 90 210 Draw a Gantt
Step by Step Solution
There are 3 Steps involved in it
Step: 1

Get Instant Access to Expert-Tailored Solutions
See step-by-step solutions with expert insights and AI powered tools for academic success
Step: 2

Step: 3
Ace Your Homework with AI
Get the answers you need in no time with our AI-driven, step-by-step assistance
Get Started
Databases Organizing Information Digital And Information Literacy
Authors: Greg Roza
1st Edition
1448805929, 978-1448805921