Answered step by step
Verified Expert Solution
Question
1 Approved Answer
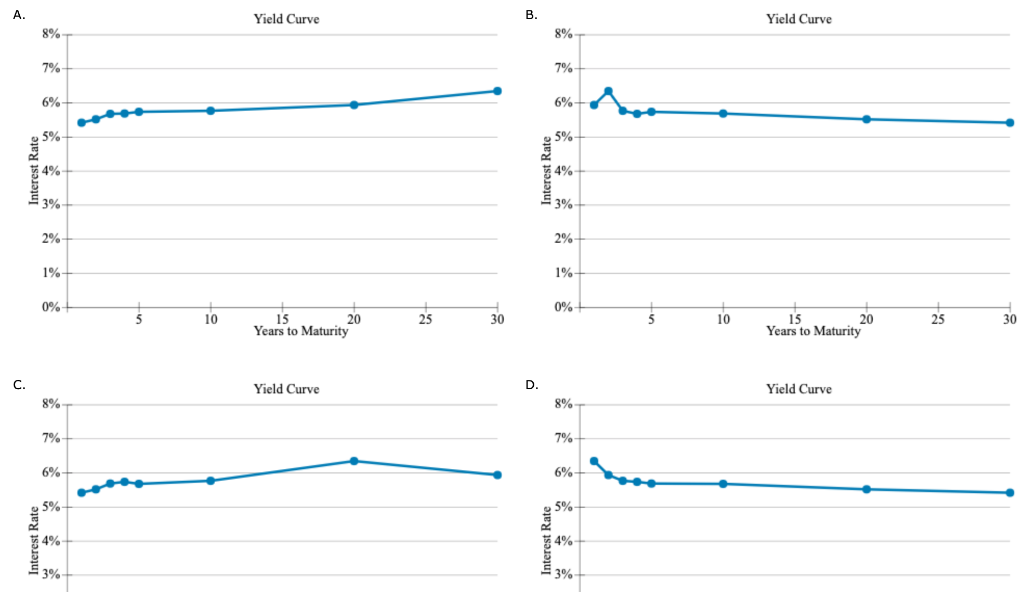
Given the following Treasury bond yield information, construct a graph of the yield curve. Maturity Yield 1 year 5.42 % 2 years 5.52 3 years
-
Given the following Treasury bond yield information, construct a graph of the yield curve.
Maturity Yield 1 year 5.42 % 2 years 5.52 3 years 5.69 4 years 5.74 5 years 5.68 10 years 5.77 20 years 6.35 30 years 5.94 Choose the correct graph.
 .
.
A. Yield Curve B. Yield Curve 8% 8% 7% 7% 6% 6% 5% 5% Interest Rate 4% Interest Rate 4% 3% 3% 2% 2% 1% 1% 0% 0% 10 25 30 15 20 Years to Maturity 5 10 25 30 15 20 Years to Maturity C. Yield Curve D. Yield Curve 8% 8% 7% 7% 6% 6% 5% 5% Interest Rate 4% Interest Rate 4% 3% 3%
Step by Step Solution
There are 3 Steps involved in it
Step: 1

Get Instant Access to Expert-Tailored Solutions
See step-by-step solutions with expert insights and AI powered tools for academic success
Step: 2

Step: 3

Ace Your Homework with AI
Get the answers you need in no time with our AI-driven, step-by-step assistance
Get Started


