Question
Given the Forecasts and Observed Demands shown below, please calculate out the MAD for each of the forecasts. Week Demand Observed 6 171 7

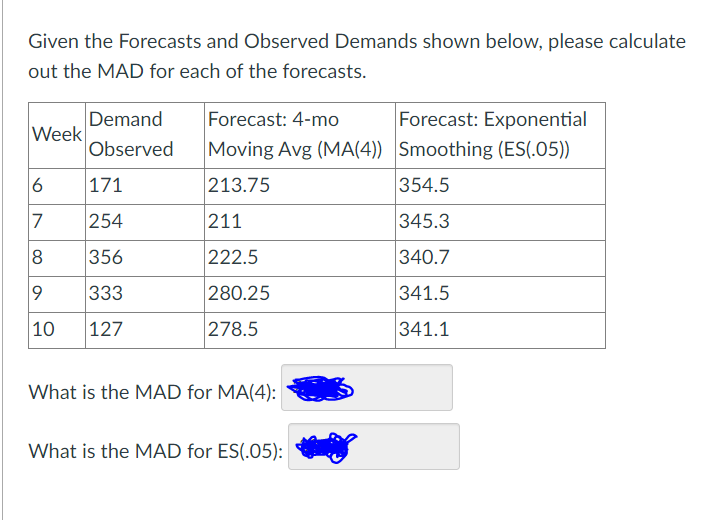
Given the Forecasts and Observed Demands shown below, please calculate out the MAD for each of the forecasts. Week Demand Observed 6 171 7 254 8 356 9 333 10 127 Forecast: 4-mo Moving Avg (MA(4)) 213.75 211 222.5 280.25 278.5 What is the MAD for MA(4): What is the MAD for ES(.05): Forecast: Exponential Smoothing (ES(.05)) 354.5 345.3 340.7 341.5 341.1
Step by Step Solution
3.61 Rating (155 Votes )
There are 3 Steps involved in it
Step: 1
To calculate the Mean Absolute Deviation MAD for each of the forecasts we follow these steps 1 Subtr...
Get Instant Access to Expert-Tailored Solutions
See step-by-step solutions with expert insights and AI powered tools for academic success
Step: 2

Step: 3

Ace Your Homework with AI
Get the answers you need in no time with our AI-driven, step-by-step assistance
Get StartedRecommended Textbook for
Operations Management Processes And Supply Chains
Authors: Lee Krajewski, Naresh Malhotra, Larry Ritzman
13th Global Edition
129240986X, 978-1292409863
Students also viewed these General Management questions
Question
Answered: 1 week ago
Question
Answered: 1 week ago
Question
Answered: 1 week ago
Question
Answered: 1 week ago
Question
Answered: 1 week ago
Question
Answered: 1 week ago
Question
Answered: 1 week ago
Question
Answered: 1 week ago
Question
Answered: 1 week ago
Question
Answered: 1 week ago
Question
Answered: 1 week ago
Question
Answered: 1 week ago
Question
Answered: 1 week ago
Question
Answered: 1 week ago
Question
Answered: 1 week ago
Question
Answered: 1 week ago
Question
Answered: 1 week ago
Question
Answered: 1 week ago
Question
Answered: 1 week ago
Question
Answered: 1 week ago
Question
Answered: 1 week ago
Question
Answered: 1 week ago
Question
Answered: 1 week ago
View Answer in SolutionInn App


