

Answered step by step
Verified Expert Solution
Question
1 Approved Answer
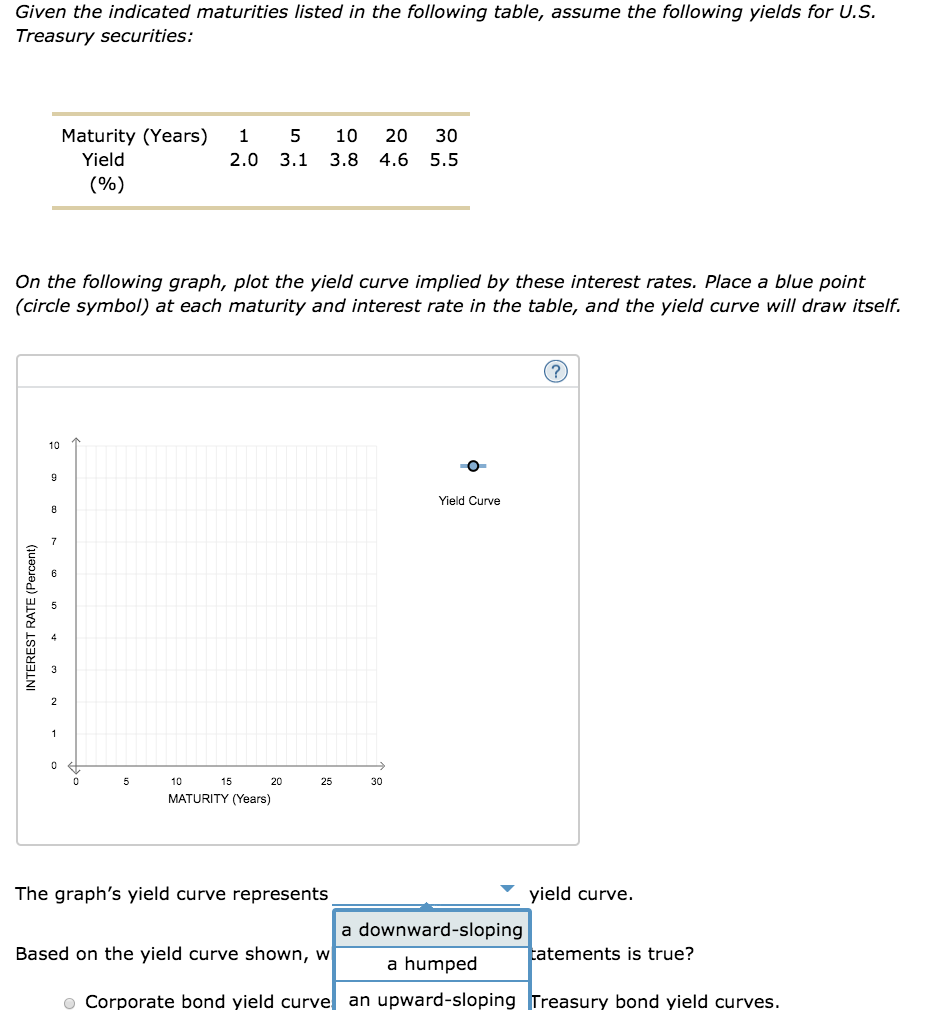
Given the indicated maturities listed in the following table, assume the following yields for U.S Treasury securities: Maturity (Years) 1 5 10 20 30 2.0
Step by Step Solution
There are 3 Steps involved in it
Step: 1

Get Instant Access to Expert-Tailored Solutions
See step-by-step solutions with expert insights and AI powered tools for academic success
Step: 2

Step: 3
Ace Your Homework with AI
Get the answers you need in no time with our AI-driven, step-by-step assistance
Get Started
Investing In Mortgage Backed And Asset Backed Securities
Authors: Glenn M. Schultz, Frank J. Fabozzi
1st Edition
1118944003, 978-1118944004