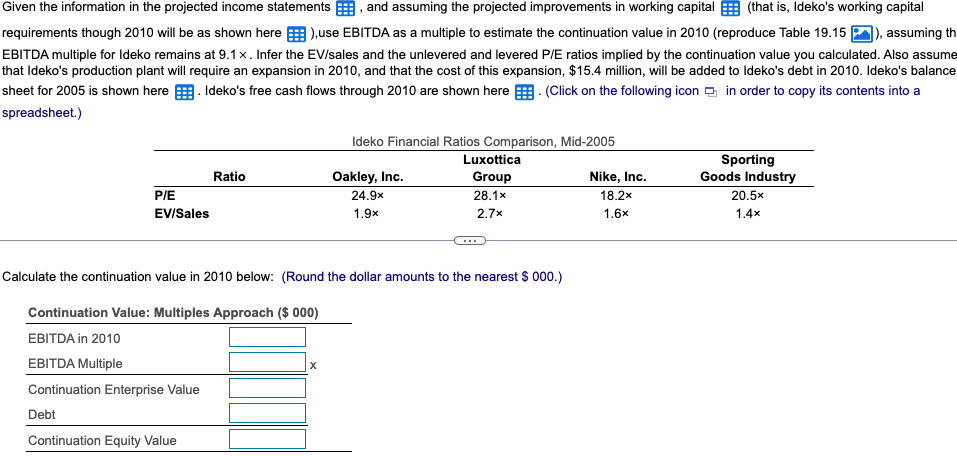
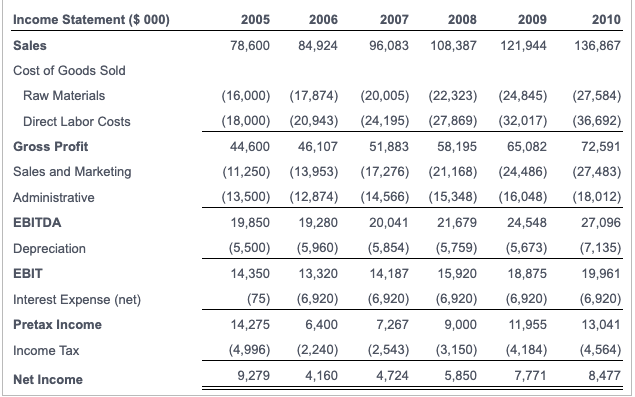
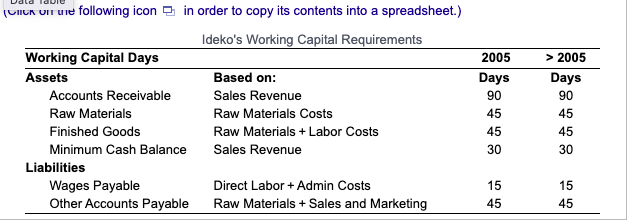
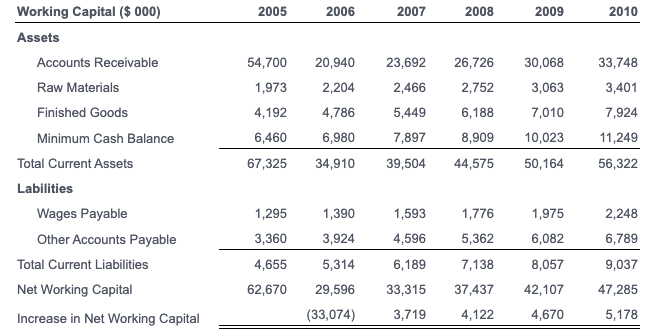
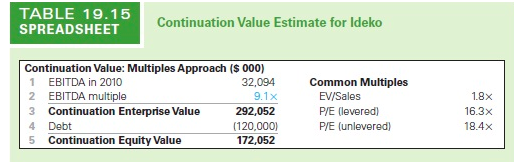
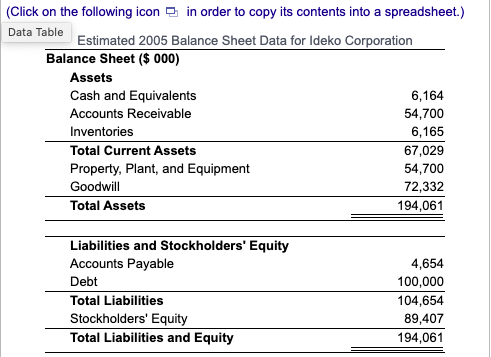
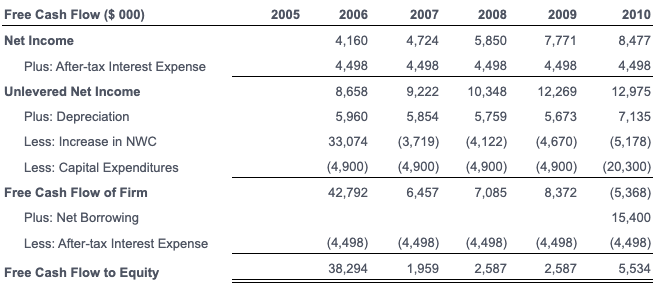
Given the information in the projected income statements and assuming the projected improvements in working capital (that is, Ideko's working capital requirements though 2010 will be as shown here ),use EBITDA as a multiple to estimate the continuation value in 2010 (reproduce Table 19.15 ), assuming th EBITDA multiple for Ideko remains at 9.1x. Infer the EV/sales and the unlevered and levered P/E ratios implied by the continuation value you calculated. Also assume that Ideko's production plant will require an expansion in 2010, and that the cost of this expansion, $15.4 million, will be added to Ideko's debt in 2010. Ideko's balance sheet for 2005 is shown here Ideko's free cash flows through 2010 are shown here (Click on the following icon in order to copy its contents into a spreadsheet.) Ideko Financial Ratios Comparison, Mid-2005 Luxottica Sporting Ratio Oakley, Inc. Group Nike, Inc. Goods Industry P/E 24.9x 28.1x 18.2x 20.5x EV/Sales 1.9x 1.6x 2.7x 1.4x Calculate the continuation value in 2010 below: (Round the dollar amounts to the nearest $ 000.) Continuation Value: Multiples Approach ($ 000) EBITDA in 2010 EBITDA Multiple Continuation Enterprise Value Debt Continuation Equity Value 2005 2006 2008 2009 2010 2007 96,083 78,600 84,924 108,387 121,944 136,867 (27,584) (36,692) 72,591 Income Statement ($ 000) Sales Cost of Goods Sold Raw Materials Direct Labor Costs Gross Profit Sales and Marketing Administrative EBITDA Depreciation EBIT Interest Expense (net) Pretax Income Income Tax Net Income (27,483) (18,012) 27,096 (16,000) (17,874) (18,000) (20,943) 44,600 46,107 (11,250) (13,953) (13,500) (12,874) 19,850 19,280 (5,500) (5,960) 14,350 13,320 (75) (6,920) 14,275 6,400 (4,996) (2,240) 9,279 4,160 (20,005) (22,323) (24,845) (24,195) (27,869) (32,017) 51,883 58,195 65,082 (17,276) (21,168) (24,486) (14,566) (15,348) (16,048) 20,041 21,679 24,548 (5,854) (5,759) (5,673) 14,187 15,920 18,875 (6,920) (6,920) (6,920) 7,267 9,000 11,955 (2,543) (3,150) (4,184) 4,724 5,850 7,771 (7,135) 19,961 (6,920) 13,041 (4,564) 8,477 2005 ICHIER UIT ure following icon 2 in order to copy its contents into a spreadsheet.) Ideko's Working Capital Requirements Working Capital Days Assets Based on: Accounts Receivable Sales Revenue Raw Materials Raw Materials Costs Finished Goods Raw Materials + Labor Costs Minimum Cash Balance Sales Revenue Liabilities Wages Payable Direct Labor + Admin Costs Other Accounts Payable Raw Materials + Sales and Marketing Days 90 45 45 30 > 2005 Days 90 45 45 30 15 45 15 45 2005 2006 2007 2008 2009 2010 54,700 1,973 4,192 6,460 67,325 Working Capital ($ 000) Assets Accounts Receivable Raw Materials Finished Goods Minimum Cash Balance Total Current Assets Labilities Wages Payable Other Accounts Payable Total Current Liabilities Net Working Capital Increase in Net Working Capital 20,940 2,204 4,786 6,980 34,910 23,692 2,466 5,449 7,897 39,504 26,726 2,752 6,188 30,068 3,063 7,010 10,023 50,164 33,748 3,401 7,924 11,249 56,322 8,909 44,575 1,295 1,390 1,593 1,776 1,975 2,248 3,360 3,924 4,596 5,362 6,082 5,314 6,189 7,138 8,057 4,655 62,670 6,789 9,037 47,285 5,178 37,437 29,596 (33,074) 33,315 3,719 42,107 4,670 4,122 TABLE 19.15 SPREADSHEET Continuation Value Estimate for Ideko Continuation Value: Multiples Approach ($ 000) 1 EBITDA in 2010 32,094 2 EBITDA multiple 9.1 x Continuation Enterprise Value 292,052 Debt (120,000) Continuation Equity Value 172,052 Common Multiples EV/Sales P/E (levered) P/E (unlevered) 3 4 1.8% 16.3x 18.4x (Click on the following icon in order to copy its contents into a spreadsheet.) Data Table Estimated 2005 Balance Sheet Data for Ideko Corporation Balance Sheet ($ 000) Assets Cash and Equivalents 6,164 Accounts Receivable 54,700 Inventories 6,165 Total Current Assets 67,029 Property, Plant, and Equipment 54,700 Goodwill 72,332 Total Assets 194,061 Liabilities and Stockholders' Equity Accounts Payable Debt Total Liabilities Stockholders' Equity Total Liabilities and Equity 4,654 100,000 104,654 89,407 194,061 2005 2008 2010 2006 4,160 5,850 4,498 2009 7,771 4,498 8,477 4,498 4,498 8,658 Free Cash Flow ($ 000) Net Income Plus: After-tax Interest Expense Unlevered Net Income Plus: Depreciation Less: Increase in NWC Less: Capital Expenditures Free Cash Flow of Firm Plus: Net Borrowing Less: After-tax Interest Expense 2007 4,724 4,498 9,222 5,854 (3,719) (4,900) 6,457 10,348 5,759 (4,122) (4,900) 7,085 5,960 33,074 (4,900) 42,792 12,269 5,673 (4,670) (4,900) 8,372 12,975 7,135 (5,178) (20,300) (5,368) 15,400 (4,498) 5,534 (4,498) (4,498) (4,498) (4,498) 38,294 Free Cash Flow to Equity 1,959 2,587 2,587 Given the information in the projected income statements and assuming the projected improvements in working capital (that is, Ideko's working capital requirements though 2010 will be as shown here ),use EBITDA as a multiple to estimate the continuation value in 2010 (reproduce Table 19.15 ), assuming th EBITDA multiple for Ideko remains at 9.1x. Infer the EV/sales and the unlevered and levered P/E ratios implied by the continuation value you calculated. Also assume that Ideko's production plant will require an expansion in 2010, and that the cost of this expansion, $15.4 million, will be added to Ideko's debt in 2010. Ideko's balance sheet for 2005 is shown here Ideko's free cash flows through 2010 are shown here (Click on the following icon in order to copy its contents into a spreadsheet.) Ideko Financial Ratios Comparison, Mid-2005 Luxottica Sporting Ratio Oakley, Inc. Group Nike, Inc. Goods Industry P/E 24.9x 28.1x 18.2x 20.5x EV/Sales 1.9x 1.6x 2.7x 1.4x Calculate the continuation value in 2010 below: (Round the dollar amounts to the nearest $ 000.) Continuation Value: Multiples Approach ($ 000) EBITDA in 2010 EBITDA Multiple Continuation Enterprise Value Debt Continuation Equity Value 2005 2006 2008 2009 2010 2007 96,083 78,600 84,924 108,387 121,944 136,867 (27,584) (36,692) 72,591 Income Statement ($ 000) Sales Cost of Goods Sold Raw Materials Direct Labor Costs Gross Profit Sales and Marketing Administrative EBITDA Depreciation EBIT Interest Expense (net) Pretax Income Income Tax Net Income (27,483) (18,012) 27,096 (16,000) (17,874) (18,000) (20,943) 44,600 46,107 (11,250) (13,953) (13,500) (12,874) 19,850 19,280 (5,500) (5,960) 14,350 13,320 (75) (6,920) 14,275 6,400 (4,996) (2,240) 9,279 4,160 (20,005) (22,323) (24,845) (24,195) (27,869) (32,017) 51,883 58,195 65,082 (17,276) (21,168) (24,486) (14,566) (15,348) (16,048) 20,041 21,679 24,548 (5,854) (5,759) (5,673) 14,187 15,920 18,875 (6,920) (6,920) (6,920) 7,267 9,000 11,955 (2,543) (3,150) (4,184) 4,724 5,850 7,771 (7,135) 19,961 (6,920) 13,041 (4,564) 8,477 2005 ICHIER UIT ure following icon 2 in order to copy its contents into a spreadsheet.) Ideko's Working Capital Requirements Working Capital Days Assets Based on: Accounts Receivable Sales Revenue Raw Materials Raw Materials Costs Finished Goods Raw Materials + Labor Costs Minimum Cash Balance Sales Revenue Liabilities Wages Payable Direct Labor + Admin Costs Other Accounts Payable Raw Materials + Sales and Marketing Days 90 45 45 30 > 2005 Days 90 45 45 30 15 45 15 45 2005 2006 2007 2008 2009 2010 54,700 1,973 4,192 6,460 67,325 Working Capital ($ 000) Assets Accounts Receivable Raw Materials Finished Goods Minimum Cash Balance Total Current Assets Labilities Wages Payable Other Accounts Payable Total Current Liabilities Net Working Capital Increase in Net Working Capital 20,940 2,204 4,786 6,980 34,910 23,692 2,466 5,449 7,897 39,504 26,726 2,752 6,188 30,068 3,063 7,010 10,023 50,164 33,748 3,401 7,924 11,249 56,322 8,909 44,575 1,295 1,390 1,593 1,776 1,975 2,248 3,360 3,924 4,596 5,362 6,082 5,314 6,189 7,138 8,057 4,655 62,670 6,789 9,037 47,285 5,178 37,437 29,596 (33,074) 33,315 3,719 42,107 4,670 4,122 TABLE 19.15 SPREADSHEET Continuation Value Estimate for Ideko Continuation Value: Multiples Approach ($ 000) 1 EBITDA in 2010 32,094 2 EBITDA multiple 9.1 x Continuation Enterprise Value 292,052 Debt (120,000) Continuation Equity Value 172,052 Common Multiples EV/Sales P/E (levered) P/E (unlevered) 3 4 1.8% 16.3x 18.4x (Click on the following icon in order to copy its contents into a spreadsheet.) Data Table Estimated 2005 Balance Sheet Data for Ideko Corporation Balance Sheet ($ 000) Assets Cash and Equivalents 6,164 Accounts Receivable 54,700 Inventories 6,165 Total Current Assets 67,029 Property, Plant, and Equipment 54,700 Goodwill 72,332 Total Assets 194,061 Liabilities and Stockholders' Equity Accounts Payable Debt Total Liabilities Stockholders' Equity Total Liabilities and Equity 4,654 100,000 104,654 89,407 194,061 2005 2008 2010 2006 4,160 5,850 4,498 2009 7,771 4,498 8,477 4,498 4,498 8,658 Free Cash Flow ($ 000) Net Income Plus: After-tax Interest Expense Unlevered Net Income Plus: Depreciation Less: Increase in NWC Less: Capital Expenditures Free Cash Flow of Firm Plus: Net Borrowing Less: After-tax Interest Expense 2007 4,724 4,498 9,222 5,854 (3,719) (4,900) 6,457 10,348 5,759 (4,122) (4,900) 7,085 5,960 33,074 (4,900) 42,792 12,269 5,673 (4,670) (4,900) 8,372 12,975 7,135 (5,178) (20,300) (5,368) 15,400 (4,498) 5,534 (4,498) (4,498) (4,498) (4,498) 38,294 Free Cash Flow to Equity 1,959 2,587 2,587