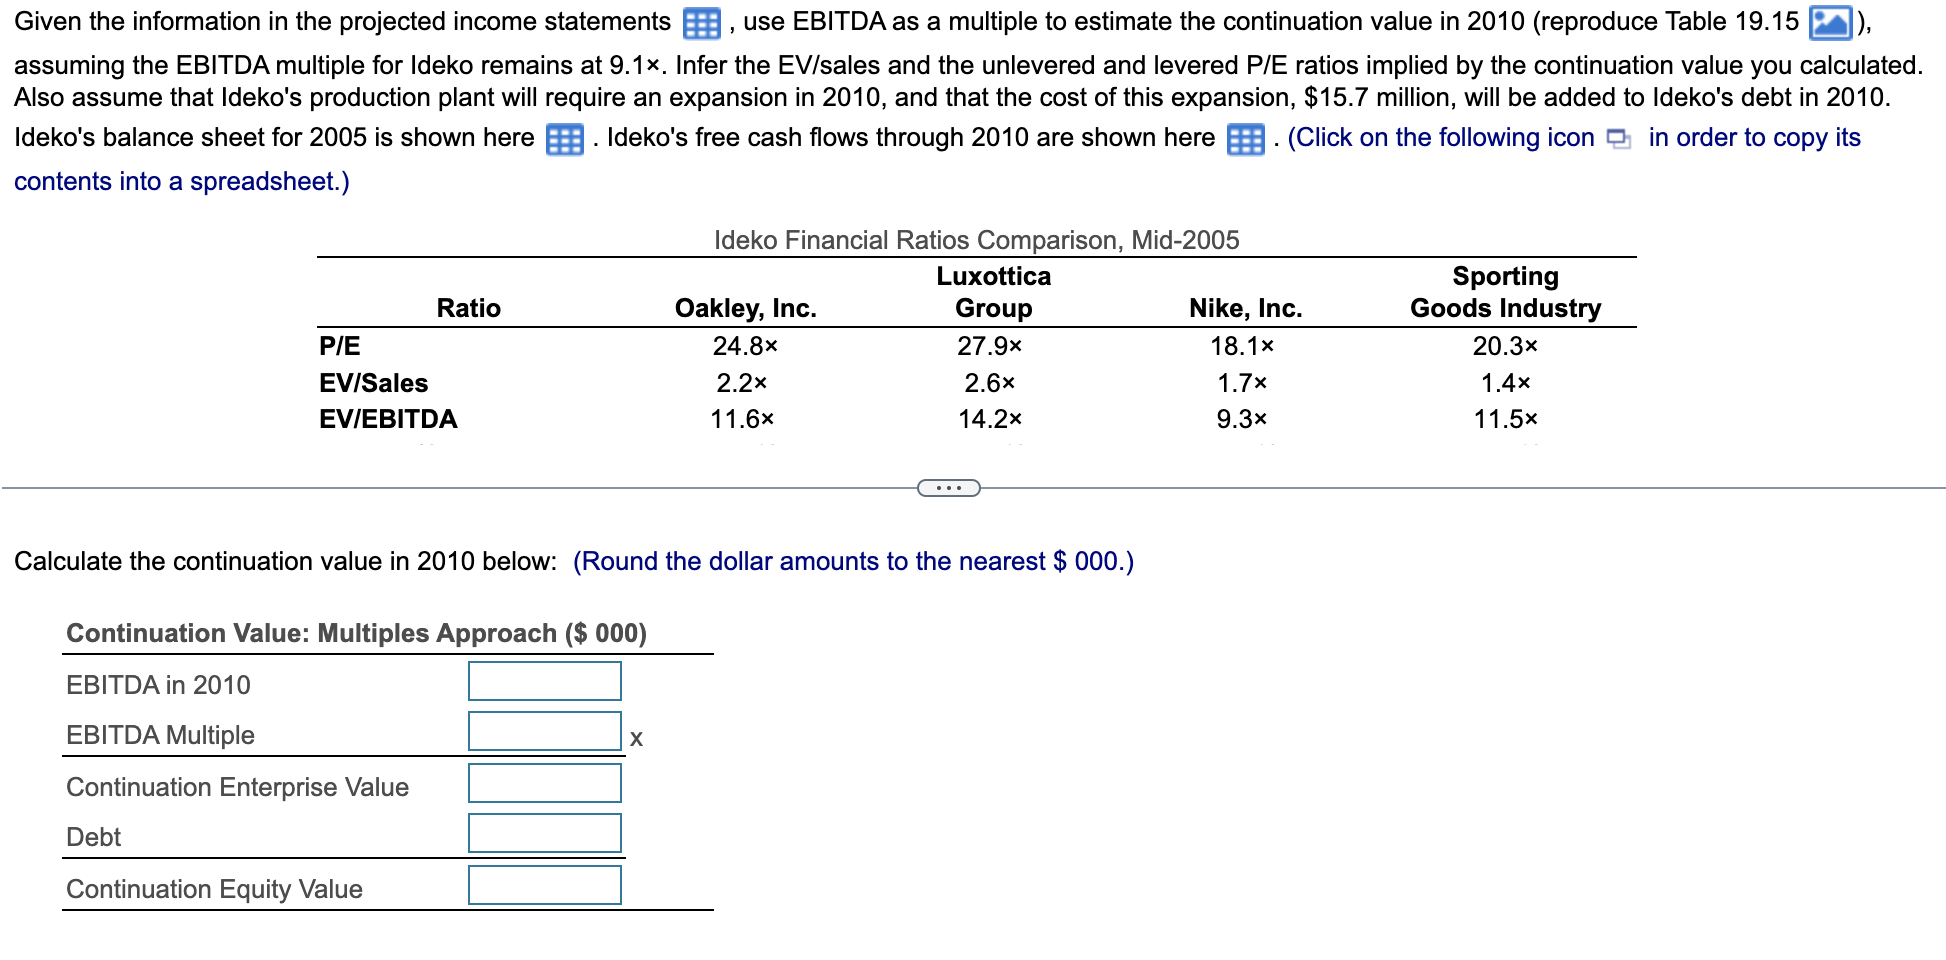
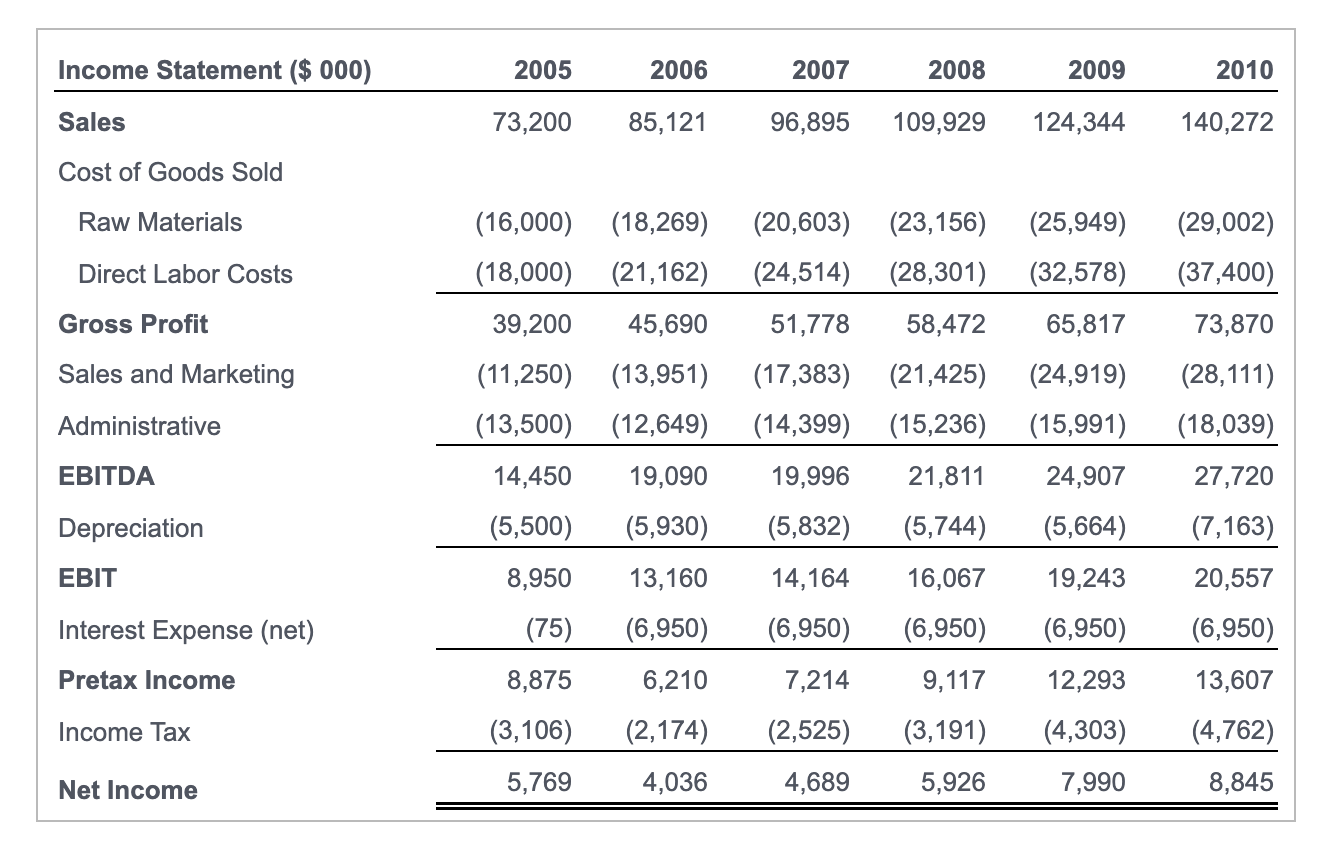
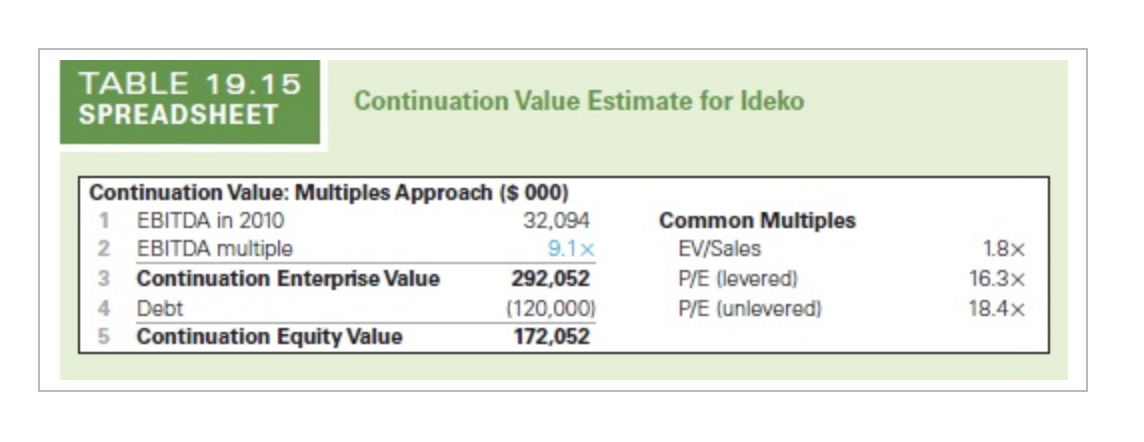
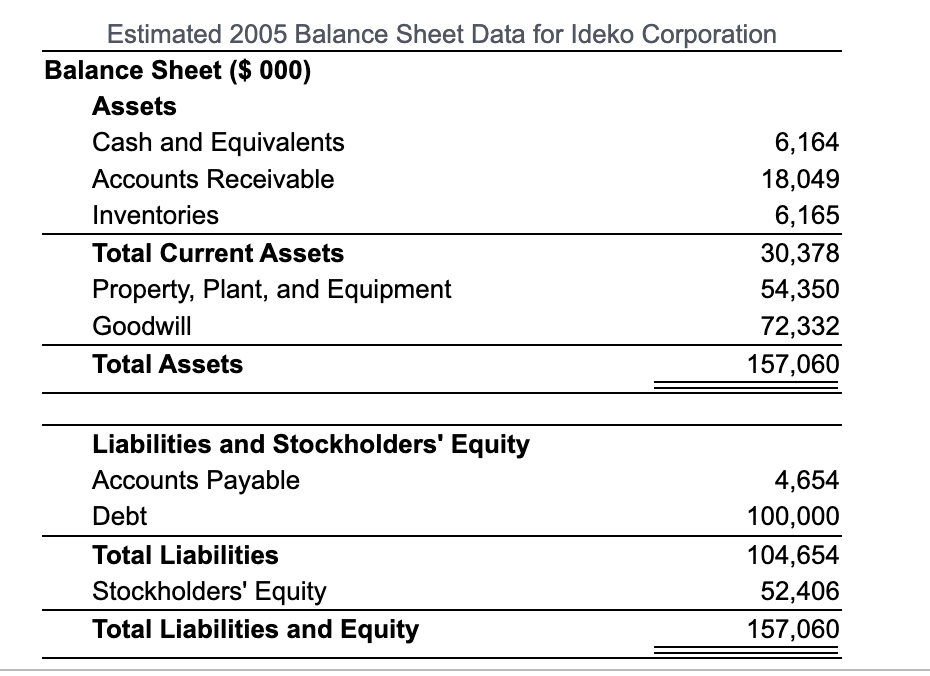
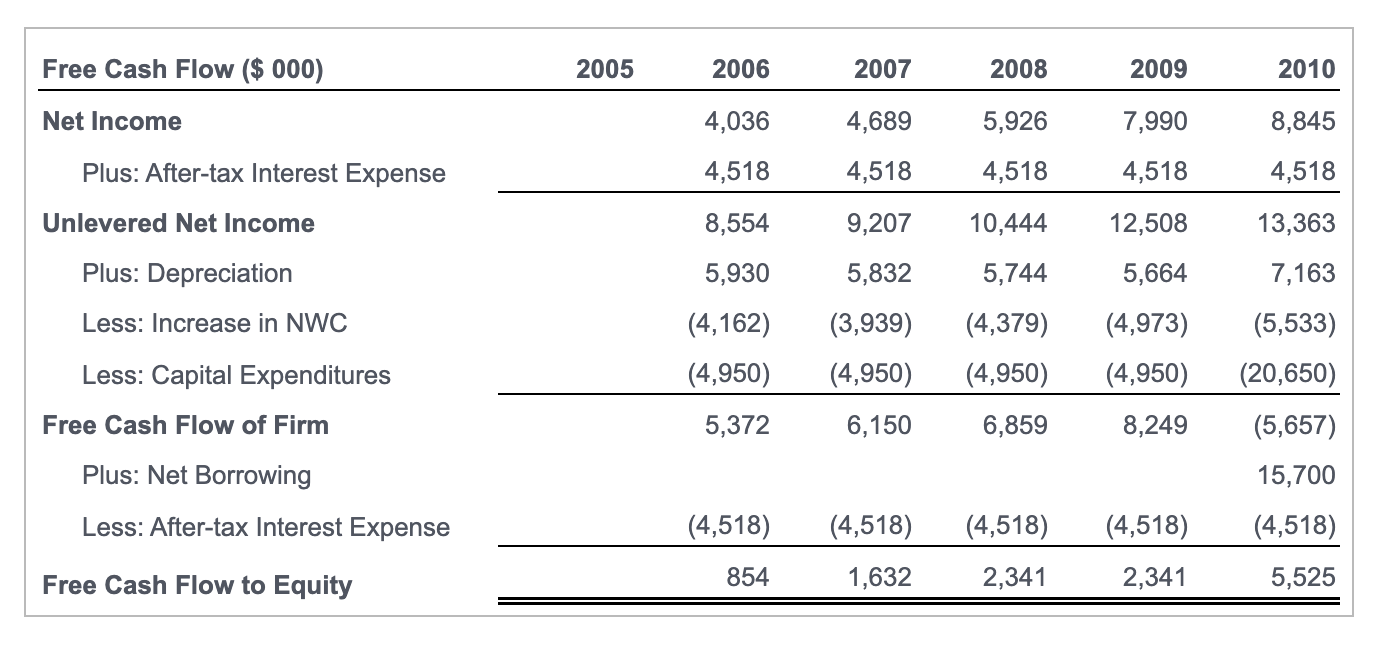
Given the information in the projected income statements B, use EBITDA as a multiple to estimate the continuation value in 2010 (reproduce Table 19.15 l), assuming the EBITDA multiple for Ideko remains at 9.1x. Infer the EV/sales and the unlevered and levered P/E ratios implied by the continuation value you calculated. Also assume that Ideko's production plant will require an expansion in 2010, and that the cost of this expansion, $15.7 million, will be added to Ideko's debt in 2010. Ideko's balance sheet for 2005 is shown here Ideko's free cash flows through 2010 are shown here E. (Click on the following icon in order to copy its contents into a spreadsheet.) Ratio Ideko Financial Ratios Comparison, Mid-2005 Luxottica Oakley, Inc. Group Nike, Inc. 24.8x 27.9x 18.1x 2.2x 2.6x 1.7x 11.6x 14.2x 9.3x P/E EV/Sales EV/EBITDA Sporting Goods Industry 20.3x 1.4x 11.5x Calculate the continuation value in 2010 below: (Round the dollar amounts to the nearest $ 000.) Continuation Value: Multiples Approach ($ 000) EBITDA in 2010 EBITDA Multiple Continuation Enterprise Value Debt Continuation Equity Value Income Statement ($ 000) 2005 2006 2007 2008 2009 2010 Sales 73,200 85,121 96,895 109,929 124,344 140,272 Cost of Goods Sold Raw Materials (16,000) (18,269) (18,000) (21,162) (20,603) (23,156) (24,514) (28,301) (25,949) (32,578) (29,002) (37,400) Direct Labor Costs Gross Profit 39,200 45,690 51,778 58,472 65,817 73,870 Sales and Marketing (11,250) (13,500) (13,951) (12,649) (24,919) (15,991) (28,111) (18,039) Administrative (17,383) (21,425) (14,399) (15,236) 19,996 21,811 (5,832) (5,744) EBITDA 14,450 19,090 24,907 27,720 Depreciation (5,500) (5,930) (5,664) (7,163) EBIT 8,950 13,160 14,164 16,067 19,243 20,557 Interest Expense (net) (75) (6,950) (6,950) (6,950) (6,950) (6,950) Pretax Income 8,875 6,210 7,214 9,117 12,293 13,607 Income Tax (3,106) (2,525) (3,191) (4,303) (4,762) (2,174) 4,036 Net Income 5,769 4,689 5,926 7,990 8,845 TABLE 19.15 SPREADSHEET Continuation Value Estimate for ldeko Continuation Value: Multiples Approach ($ 000) 1 EBITDA in 2010 32,094 2 EBITDA multiple 9.1x 3 Continuation Enterprise Value 292,052 4 Debt (120,000) 5 Continuation Equity Value 172,052 Common Multiples EV/Sales P/E (levered) P/E (unlevered) 1.8x 16.3x 18.4x Estimated 2005 Balance Sheet Data for Ideko Corporation Balance Sheet ($ 000) Assets Cash and Equivalents 6,164 Accounts Receivable 18,049 Inventories 6,165 Total Current Assets 30,378 Property, Plant, and Equipment 54,350 Goodwill 72,332 Total Assets 157,060 Liabilities and Stockholders' Equity Accounts Payable Debt Total Liabilities Stockholders' Equity Total Liabilities and Equity 4,654 100,000 104,654 52,406 157,060 Free Cash Flow ($ 000) 2005 2006 2007 2008 2009 2010 Net Income 4,036 4,689 5,926 7,990 8,845 4,518 4,518 4,518 4,518 4,518 Plus: After-tax Interest Expense Unlevered Net Income 8,554 9,207 10,444 12,508 13,363 Plus: Depreciation 5,930 5,832 5,744 5,664 7,163 Less: Increase in NWC (4,379) (4,162) (4,950) (3,939) (4,950) (4,973) (4,950) (5,533) (20,650) Less: Capital Expenditures (4,950) Free Cash Flow of Firm 5,372 6,150 6,859 8,249 (5,657) Plus: Net Borrowing 15,700 Less: After-tax Interest Expense (4,518) (4,518) (4,518) (4,518) (4,518) Free Cash Flow to Equity 854 1,632 2,341 2,341 5,525 Given the information in the projected income statements B, use EBITDA as a multiple to estimate the continuation value in 2010 (reproduce Table 19.15 l), assuming the EBITDA multiple for Ideko remains at 9.1x. Infer the EV/sales and the unlevered and levered P/E ratios implied by the continuation value you calculated. Also assume that Ideko's production plant will require an expansion in 2010, and that the cost of this expansion, $15.7 million, will be added to Ideko's debt in 2010. Ideko's balance sheet for 2005 is shown here Ideko's free cash flows through 2010 are shown here E. (Click on the following icon in order to copy its contents into a spreadsheet.) Ratio Ideko Financial Ratios Comparison, Mid-2005 Luxottica Oakley, Inc. Group Nike, Inc. 24.8x 27.9x 18.1x 2.2x 2.6x 1.7x 11.6x 14.2x 9.3x P/E EV/Sales EV/EBITDA Sporting Goods Industry 20.3x 1.4x 11.5x Calculate the continuation value in 2010 below: (Round the dollar amounts to the nearest $ 000.) Continuation Value: Multiples Approach ($ 000) EBITDA in 2010 EBITDA Multiple Continuation Enterprise Value Debt Continuation Equity Value Income Statement ($ 000) 2005 2006 2007 2008 2009 2010 Sales 73,200 85,121 96,895 109,929 124,344 140,272 Cost of Goods Sold Raw Materials (16,000) (18,269) (18,000) (21,162) (20,603) (23,156) (24,514) (28,301) (25,949) (32,578) (29,002) (37,400) Direct Labor Costs Gross Profit 39,200 45,690 51,778 58,472 65,817 73,870 Sales and Marketing (11,250) (13,500) (13,951) (12,649) (24,919) (15,991) (28,111) (18,039) Administrative (17,383) (21,425) (14,399) (15,236) 19,996 21,811 (5,832) (5,744) EBITDA 14,450 19,090 24,907 27,720 Depreciation (5,500) (5,930) (5,664) (7,163) EBIT 8,950 13,160 14,164 16,067 19,243 20,557 Interest Expense (net) (75) (6,950) (6,950) (6,950) (6,950) (6,950) Pretax Income 8,875 6,210 7,214 9,117 12,293 13,607 Income Tax (3,106) (2,525) (3,191) (4,303) (4,762) (2,174) 4,036 Net Income 5,769 4,689 5,926 7,990 8,845 TABLE 19.15 SPREADSHEET Continuation Value Estimate for ldeko Continuation Value: Multiples Approach ($ 000) 1 EBITDA in 2010 32,094 2 EBITDA multiple 9.1x 3 Continuation Enterprise Value 292,052 4 Debt (120,000) 5 Continuation Equity Value 172,052 Common Multiples EV/Sales P/E (levered) P/E (unlevered) 1.8x 16.3x 18.4x Estimated 2005 Balance Sheet Data for Ideko Corporation Balance Sheet ($ 000) Assets Cash and Equivalents 6,164 Accounts Receivable 18,049 Inventories 6,165 Total Current Assets 30,378 Property, Plant, and Equipment 54,350 Goodwill 72,332 Total Assets 157,060 Liabilities and Stockholders' Equity Accounts Payable Debt Total Liabilities Stockholders' Equity Total Liabilities and Equity 4,654 100,000 104,654 52,406 157,060 Free Cash Flow ($ 000) 2005 2006 2007 2008 2009 2010 Net Income 4,036 4,689 5,926 7,990 8,845 4,518 4,518 4,518 4,518 4,518 Plus: After-tax Interest Expense Unlevered Net Income 8,554 9,207 10,444 12,508 13,363 Plus: Depreciation 5,930 5,832 5,744 5,664 7,163 Less: Increase in NWC (4,379) (4,162) (4,950) (3,939) (4,950) (4,973) (4,950) (5,533) (20,650) Less: Capital Expenditures (4,950) Free Cash Flow of Firm 5,372 6,150 6,859 8,249 (5,657) Plus: Net Borrowing 15,700 Less: After-tax Interest Expense (4,518) (4,518) (4,518) (4,518) (4,518) Free Cash Flow to Equity 854 1,632 2,341 2,341 5,525