Answered step by step
Verified Expert Solution
Question
1 Approved Answer
Given the information presented below a) Complete these tables using common-size analysis; b) Summarize and indicate possible red flags underneath the financial stataments. (SHOW WORK-MUST
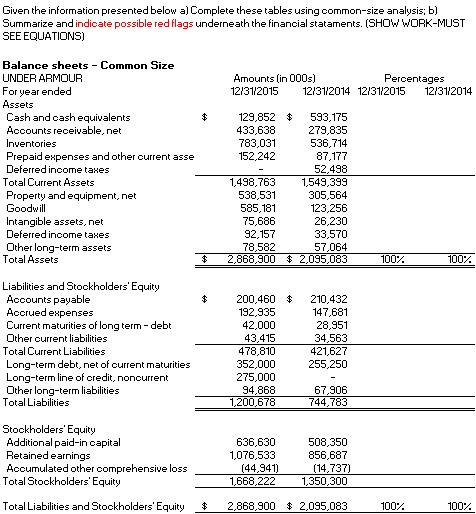
Given the information presented below a) Complete these tables using common-size analysis; b) Summarize and indicate possible red flags underneath the financial stataments. (SHOW WORK-MUST SEE EQUATIONS) Balance sheets Common Size UNDER ARMOUR For year ended Assets Cash and cash equivalents Accounts receivable, net Inventories Prepaid expenses a Deferred income taHes Total Current Assets Property and equipment, net Goodwill Intangible assets, net Deferred income tanes Other long-term assets Total Assets Amounts lin 000s) 1213112015 Percentages 123112014 1213112015 1213112014 129.852 $593,175 279,835 536.714 87,177 52,498 1,498,763 1549.399 305,564 123,256 26,230 33,570 57,064 95,083 433,638 783,031 152,242 nd other current asse 538,531 585,181 75,686 92,157 78,582 Liabilities and Stockholders Equity Accounts payable Accrued expenses Current maturities of long term-debt Other current liabilities Total Current Liabilities Long-term debt, net of current maturities Long-term line of credit, noncurrent Other long-teliabilities Total Liabilities 192,935 42,000 43.415 478,810 352,000 275,000 94,868 $200,460 210,432 147,681 28,951 34563 421,627 255,250 67,906 44,783 Stockholders'Equity Additional paid-in capital Retainedearnings Accumulated other compre Total Stockholders Equity 636,630 1076,533 (44,941 508,350 856,687 hensive loss 1350,300 Total Liabilities and Stockholders'Equity 2,868 900 $2,095,083 100% 100%
Step by Step Solution
There are 3 Steps involved in it
Step: 1
Get Instant Access to Expert-Tailored Solutions
See step-by-step solutions with expert insights and AI powered tools for academic success
Step: 2
Step: 3
Ace Your Homework with AI
Get the answers you need in no time with our AI-driven, step-by-step assistance
Get Started