Answered step by step
Verified Expert Solution
Question
1 Approved Answer
Given the table below for Amazon, provide a 2 year forecast on project income. Provide as much detail as possible please. Breakdown TTM 12/31/2019 12/31/2018
Given the table below for Amazon, provide a 2 year forecast on project income. Provide as much detail as possible please.
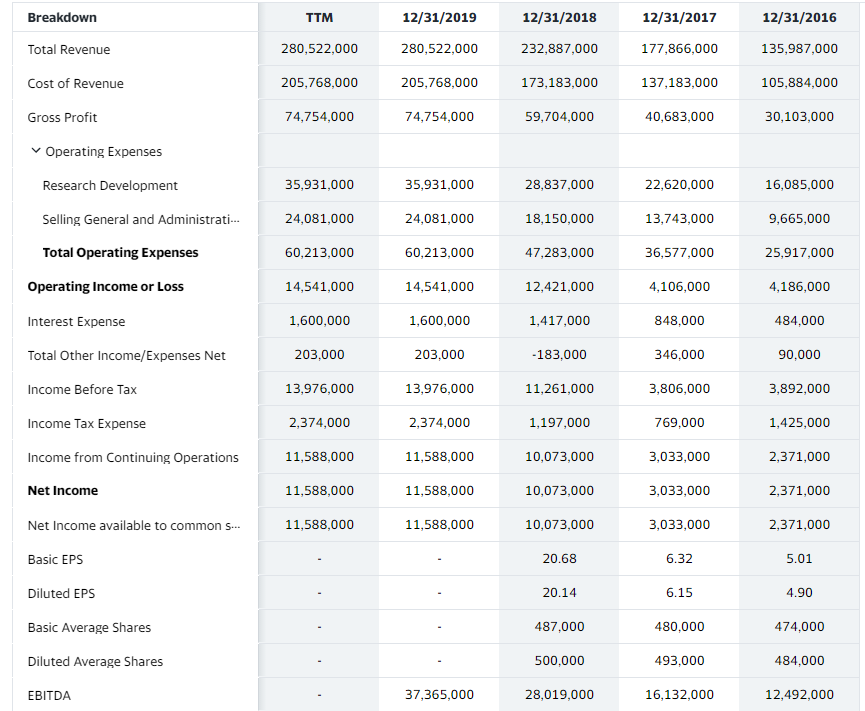
Breakdown TTM 12/31/2019 12/31/2018 12/31/2017 12/31/2016 Total Revenue 280,522,000 280,522,000 232,887,000 177,866,000 135,987,000 Cost of Revenue 205,768,000 205,768,000 173,183,000 137,183,000 105,884,000 Gross Profit 74,754,000 74,754,000 59,704,000 40,683,000 30,103,000 Operating Expenses Research Development 35,931,000 35,931,000 28,837,000 22,620,000 16,085,000 Selling General and Administrati... 24,081,000 24,081,000 18,150,000 13,743,000 9,665,000 Total Operating Expenses 60,213,000 60,213,000 47,283,000 36,577,000 25,917,000 Operating Income or Loss 14,541,000 14,541,000 12,421,000 4,106,000 4,186,000 Interest Expense 1,600,000 1,600,000 1,417,000 848.000 484.000 Total Other Income/Expenses Net 203,000 203.000 -183,000 346,000 90,000 Income Before Tax 13,976,000 13,976,000 11,261,000 3,806,000 3,892,000 Income Tax Expense 2,374,000 2,374,000 1,197,000 769,000 1,425,000 Income from Continuing Operations 11,588,000 11,588,000 10,073,000 3,033,000 2,371,000 Net Income 11,588,000 11,588,000 10,073,000 3,033,000 2,371,000 Net Income available to common S... 11,588,000 11,588,000 10,073,000 3,033,000 2,371,000 Basic EPS 20.68 6.32 5.01 Diluted EPS 20.14 6.15 4.90 Basic Average Shares 487,000 480,000 474,000 Diluted Average Shares 500,000 493,000 484,000 EBITDA 37,365,000 28.019,000 16,132,000 12,492,000Step by Step Solution
There are 3 Steps involved in it
Step: 1
Get Instant Access to Expert-Tailored Solutions
See step-by-step solutions with expert insights and AI powered tools for academic success
Step: 2
Step: 3
Ace Your Homework with AI
Get the answers you need in no time with our AI-driven, step-by-step assistance
Get Started