Answered step by step
Verified Expert Solution
Question
1 Approved Answer
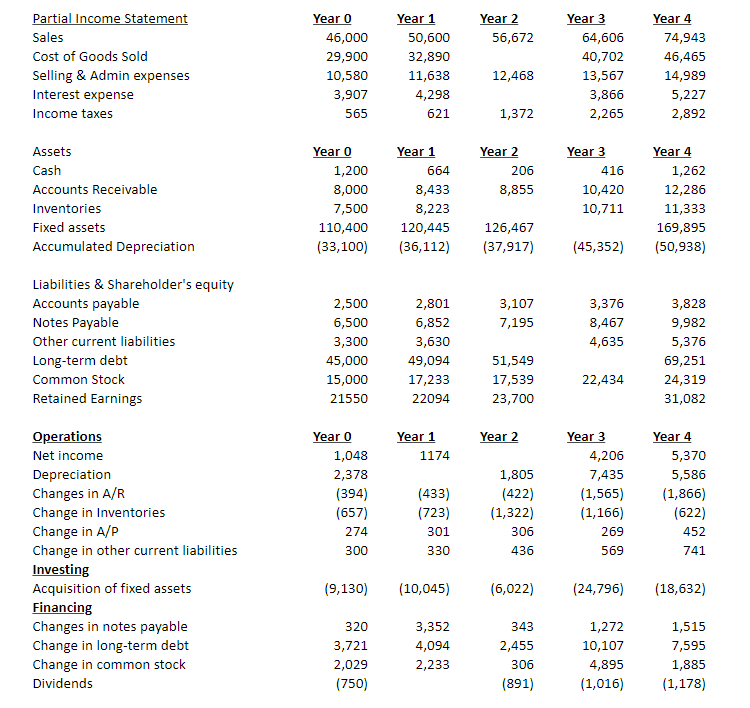
Given this partial financial statement 1) what was the amount of dividends declared year 1 2)knowing no depreciable assets were sold or retired how much

Given this partial financial statement 1) what was the amount of dividends declared year 1 2)knowing no depreciable assets were sold or retired how much was depreciation expense in year 1? 3) How much was inventory at the end of year 2? 4) What was interest expense for year 2, given an interest rate of 6%?
Year 2 56,672 Partial Income Statement Sales Cost of Goods Sold Selling & Admin expenses Interest expense Income taxes Year 0 46,000 29,900 10,580 3,907 565 Year 1 50,600 32,890 11,638 4,298 621 Year 3 64,606 40,702 13,567 3,866 2,265 Year 4 74,943 46,465 14,989 5,227 2,892 12,468 1,372 Year 1 664 Year 2 206 8,855 Assets Cash Accounts Receivable Inventories Fixed assets Accumulated Depreciation Year o 1,200 8,000 7,500 110,400 (33,100) Year 3 416 10,420 10,711 8,433 8,223 120,445 (36,112) Year 4 1,262 12,286 11,333 169,895 (50,938) 126,467 (37,917) (45,352) 3,107 7,195 Liabilities & Shareholder's equity Accounts payable Notes Payable Other current liabilities Long-term debt Common Stock Retained Earnings 3,376 8,467 4,635 2,500 6,500 3,300 45,000 15,000 21550 2,801 6,852 3,630 49,094 17,233 22094 3,828 9,982 5,376 69,251 24,319 31,082 51,549 17,539 23,700 22,434 Year 2 Year 1 1174 Year o 1,048 2,378 (394) (657) 274 Year 3 4,206 7,435 (1,565) (1,166) 269 1,805 (422) (1,322) 306 Year 4 5,370 5,586 (1,866) (622) 452 (433) (723) 301 300 330 436 569 741 Operations Net income Depreciation Changes in A/R Change in Inventories Change in A/P Change in other current liabilities Investing Acquisition of fixed assets Financing Changes in notes payable Change in long-term debt Change in common stock Dividends (9,130) (10,045) (6,022) (24,796) (18,632) 320 3,721 2,029 (750) 3,352 4,094 2,233 343 2,455 306 (891) 1,272 10,107 4,895 (1,016) 1,515 7,595 1,885 (1,178) Year 2 56,672 Partial Income Statement Sales Cost of Goods Sold Selling & Admin expenses Interest expense Income taxes Year 0 46,000 29,900 10,580 3,907 565 Year 1 50,600 32,890 11,638 4,298 621 Year 3 64,606 40,702 13,567 3,866 2,265 Year 4 74,943 46,465 14,989 5,227 2,892 12,468 1,372 Year 1 664 Year 2 206 8,855 Assets Cash Accounts Receivable Inventories Fixed assets Accumulated Depreciation Year o 1,200 8,000 7,500 110,400 (33,100) Year 3 416 10,420 10,711 8,433 8,223 120,445 (36,112) Year 4 1,262 12,286 11,333 169,895 (50,938) 126,467 (37,917) (45,352) 3,107 7,195 Liabilities & Shareholder's equity Accounts payable Notes Payable Other current liabilities Long-term debt Common Stock Retained Earnings 3,376 8,467 4,635 2,500 6,500 3,300 45,000 15,000 21550 2,801 6,852 3,630 49,094 17,233 22094 3,828 9,982 5,376 69,251 24,319 31,082 51,549 17,539 23,700 22,434 Year 2 Year 1 1174 Year o 1,048 2,378 (394) (657) 274 Year 3 4,206 7,435 (1,565) (1,166) 269 1,805 (422) (1,322) 306 Year 4 5,370 5,586 (1,866) (622) 452 (433) (723) 301 300 330 436 569 741 Operations Net income Depreciation Changes in A/R Change in Inventories Change in A/P Change in other current liabilities Investing Acquisition of fixed assets Financing Changes in notes payable Change in long-term debt Change in common stock Dividends (9,130) (10,045) (6,022) (24,796) (18,632) 320 3,721 2,029 (750) 3,352 4,094 2,233 343 2,455 306 (891) 1,272 10,107 4,895 (1,016) 1,515 7,595 1,885 (1,178)Step by Step Solution
There are 3 Steps involved in it
Step: 1

Get Instant Access to Expert-Tailored Solutions
See step-by-step solutions with expert insights and AI powered tools for academic success
Step: 2

Step: 3

Ace Your Homework with AI
Get the answers you need in no time with our AI-driven, step-by-step assistance
Get Started


