Question
Given: X -4 -3 -2 34400 4.5 8 Y 10 4 0 -2 -3 0 4 10 18 28 40 Plot this set of

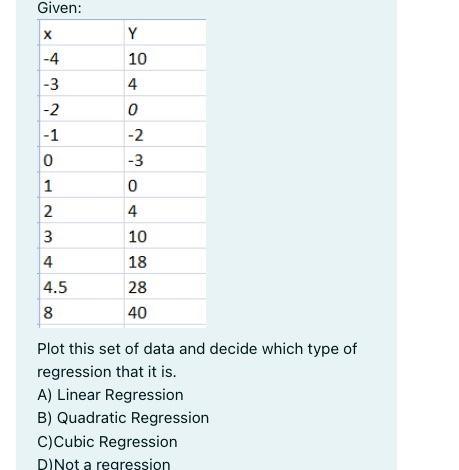
Given: X -4 -3 -2 34400 4.5 8 Y 10 4 0 -2 -3 0 4 10 18 28 40 Plot this set of data and decide which type of regression that it is. A) Linear Regression B) Quadratic Regression C) Cubic Regression D)Not a regression
Step by Step Solution
3.52 Rating (162 Votes )
There are 3 Steps involved in it
Step: 1
Answer Here is the graph The data appears ...
Get Instant Access to Expert-Tailored Solutions
See step-by-step solutions with expert insights and AI powered tools for academic success
Step: 2

Step: 3

Ace Your Homework with AI
Get the answers you need in no time with our AI-driven, step-by-step assistance
Get StartedRecommended Textbook for
Applied Regression Analysis And Other Multivariable Methods
Authors: David G. Kleinbaum, Lawrence L. Kupper, Azhar Nizam, Eli S. Rosenberg
5th Edition
1285051084, 978-1285963754, 128596375X, 978-1285051086
Students also viewed these Accounting questions
Question
Answered: 1 week ago
Question
Answered: 1 week ago
Question
Answered: 1 week ago
Question
Answered: 1 week ago
Question
Answered: 1 week ago
Question
Answered: 1 week ago
Question
Answered: 1 week ago
Question
Answered: 1 week ago
Question
Answered: 1 week ago
Question
Answered: 1 week ago
Question
Answered: 1 week ago
Question
Answered: 1 week ago
Question
Answered: 1 week ago
Question
Answered: 1 week ago
Question
Answered: 1 week ago
Question
Answered: 1 week ago
Question
Answered: 1 week ago
Question
Answered: 1 week ago
Question
Answered: 1 week ago
Question
Answered: 1 week ago
Question
Answered: 1 week ago
View Answer in SolutionInn App


