Answered step by step
Verified Expert Solution
Question
1 Approved Answer
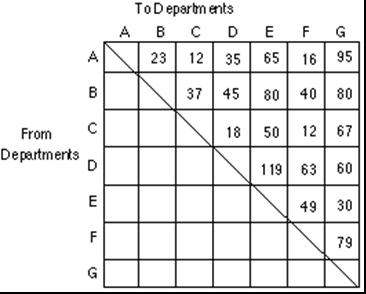
Giving the following from-to-chart (The numbers in the table represent the flow in number of units of a given product) Give examples of other units
Giving the following from-to-chart (The numbers in the table represent the flow in number of units of a given product)
Give examples of other units that can represent the numbers in the table
Use one of the graph theoretic approaches discussed in class to design the layout
Use ALDEP to design the layout (Assume any data, information you need)

A B From Departments D G To Departments A B C 23 12 12 37 D E F G 35 65 16 95 45 80 40 80 18 50 12 67 119 63 60 49 30 79 A B From Departments D G To Departments A B C 23 12 12 37 D E F G 35 65 16 95 45 80 40 80 18 50 12 67 119 63 60 49 30 79
Step by Step Solution
★★★★★
3.52 Rating (159 Votes )
There are 3 Steps involved in it
Step: 1
To provide examples of other units that can represent the numbers in the table you can consider various alternative metrics or attributes that could r...
Get Instant Access to Expert-Tailored Solutions
See step-by-step solutions with expert insights and AI powered tools for academic success
Step: 2

Step: 3

Ace Your Homework with AI
Get the answers you need in no time with our AI-driven, step-by-step assistance
Get Started


