Answered step by step
Verified Expert Solution
Link Copied!

Question

1 Approved Answer

Giving the following table (DO the Job in Excel) Date A B C D index 3-Jan-16 84.87 14.05 67.55 41.7 6,517.71 10-Jan-16 67.02 12.25 57.84

Giving the following table (DO the Job in Excel)

Date A B C D index
3-Jan-16 84.87 14.05 67.55 41.7 6,517.71
10-Jan-16 67.02 12.25 57.84 37.4 6,038.03
17-Jan-16 54.05 9.7 45.8 34 5,459.84
24-Jan-16 59.93 10.35 47.07 38.6 5,698.56
31-Jan-16 66.53 11.4 55.09 41.1 5,927.36
7-Feb-16 64.82 11.65 52.35 42.5 5,832.92
14-Feb-16 62.13 11.2 39.89 41 5,801.65
21-Feb-16 66.28 11.3 40.74 41.8 5,942.28
28-Feb-16 68.24 11.95 42 42.8 6,170.16
6-Mar-16 67.51 12.35 47.07 44.5 6,370.37
13-Mar-16 76.07 12.8 49.39 44 6,305.78
20-Mar-16 72.15 13.35 49.18 43 6,460.98
27-Mar-16 68 13.25 50.66 41 6,215.65
3-Apr-16 64.33 13.9 43.27 41.8 6,213.58
10-Apr-16 66.04 14.5 47.7 44.5 6,442.04
17-Apr-16 66.77 14.95 47.07 47.5 6,512.43
24-Apr-16 69.95 15.05 53.61 49.1 6,820.30
1-May-16 67.26 14 57.84 48 6,586.50
8-May-16 71.18 13.55 61.64 50.5 6,654.20
15-May-16 68.97 14.2 58.68 51 6,737.40

image text in transcribed

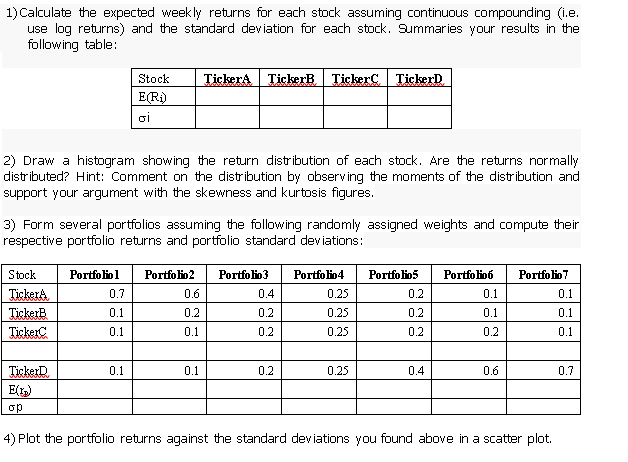
1) Calculate the expected weekly returns for each stock assuming continuous compounding (i.e. use log returns) and the standard deviation for each stock. Summaries your results in the following table: Tickers TickerB Ticker TickerD Stock E(RI) gi 2) Draw a histogram showing the return distribution of each stock. Are the returns normally distributed? Hint: Comment on the distribution by observing the moments of the distribution and support your argument with the skewness and kurtosis figures. 3) Form several portfolios assuming the following randomly assigned weights and compute their respective portfolio returns and portfolio standard deviations: Portfolio 1 0.7 Portfolio 2 0.6 Portfolio 3 0.4 0.2 Portfolio 0.2 Portfolio 0.1 Stock Tickers TickerB Ticker Portfolio 0.1 Portfolio 4 0.25 0.25 0.25 0.1 0.2 0.2 0.1 0.1 0.1 0.1 0.2 0.2 0.2 0.1 0.1 0.1 0.2 0.25 0.4 0.6 0.7 Tickers E{ID) op 4) Plot the portfolio returns against the standard deviations you found above in a scatter plot. 1) Calculate the expected weekly returns for each stock assuming continuous compounding (i.e. use log returns) and the standard deviation for each stock. Summaries your results in the following table: Tickers TickerB Ticker TickerD Stock E(RI) gi 2) Draw a histogram showing the return distribution of each stock. Are the returns normally distributed? Hint: Comment on the distribution by observing the moments of the distribution and support your argument with the skewness and kurtosis figures. 3) Form several portfolios assuming the following randomly assigned weights and compute their respective portfolio returns and portfolio standard deviations: Portfolio 1 0.7 Portfolio 2 0.6 Portfolio 3 0.4 0.2 Portfolio 0.2 Portfolio 0.1 Stock Tickers TickerB Ticker Portfolio 0.1 Portfolio 4 0.25 0.25 0.25 0.1 0.2 0.2 0.1 0.1 0.1 0.1 0.2 0.2 0.2 0.1 0.1 0.1 0.2 0.25 0.4 0.6 0.7 Tickers E{ID) op 4) Plot the portfolio returns against the standard deviations you found above in a scatter plot

Step by Step Solution

There are 3 Steps involved in it

Step: 1

blur-text-image

Get Instant Access to Expert-Tailored Solutions

See step-by-step solutions with expert insights and AI powered tools for academic success

Step: 2

blur-text-image

Step: 3

blur-text-image

Ace Your Homework with AI

Get the answers you need in no time with our AI-driven, step-by-step assistance

Get Started

Recommended Textbook for

Banking Secrecy And Global Finance

Authors: Donato Masciandaro, Olga Balakina

1st Edition

1137400099, 978-1137400093

More Books

Students also viewed these Finance questions