

Answered step by step
Verified Expert Solution
Question
1 Approved Answer
Global Inc. produces, markets, distributes, and installs durable kitchen equipment. Global's 2020 and 2019 balance sheets and income statements follow. Global Inc. Balance Sheet ($000)
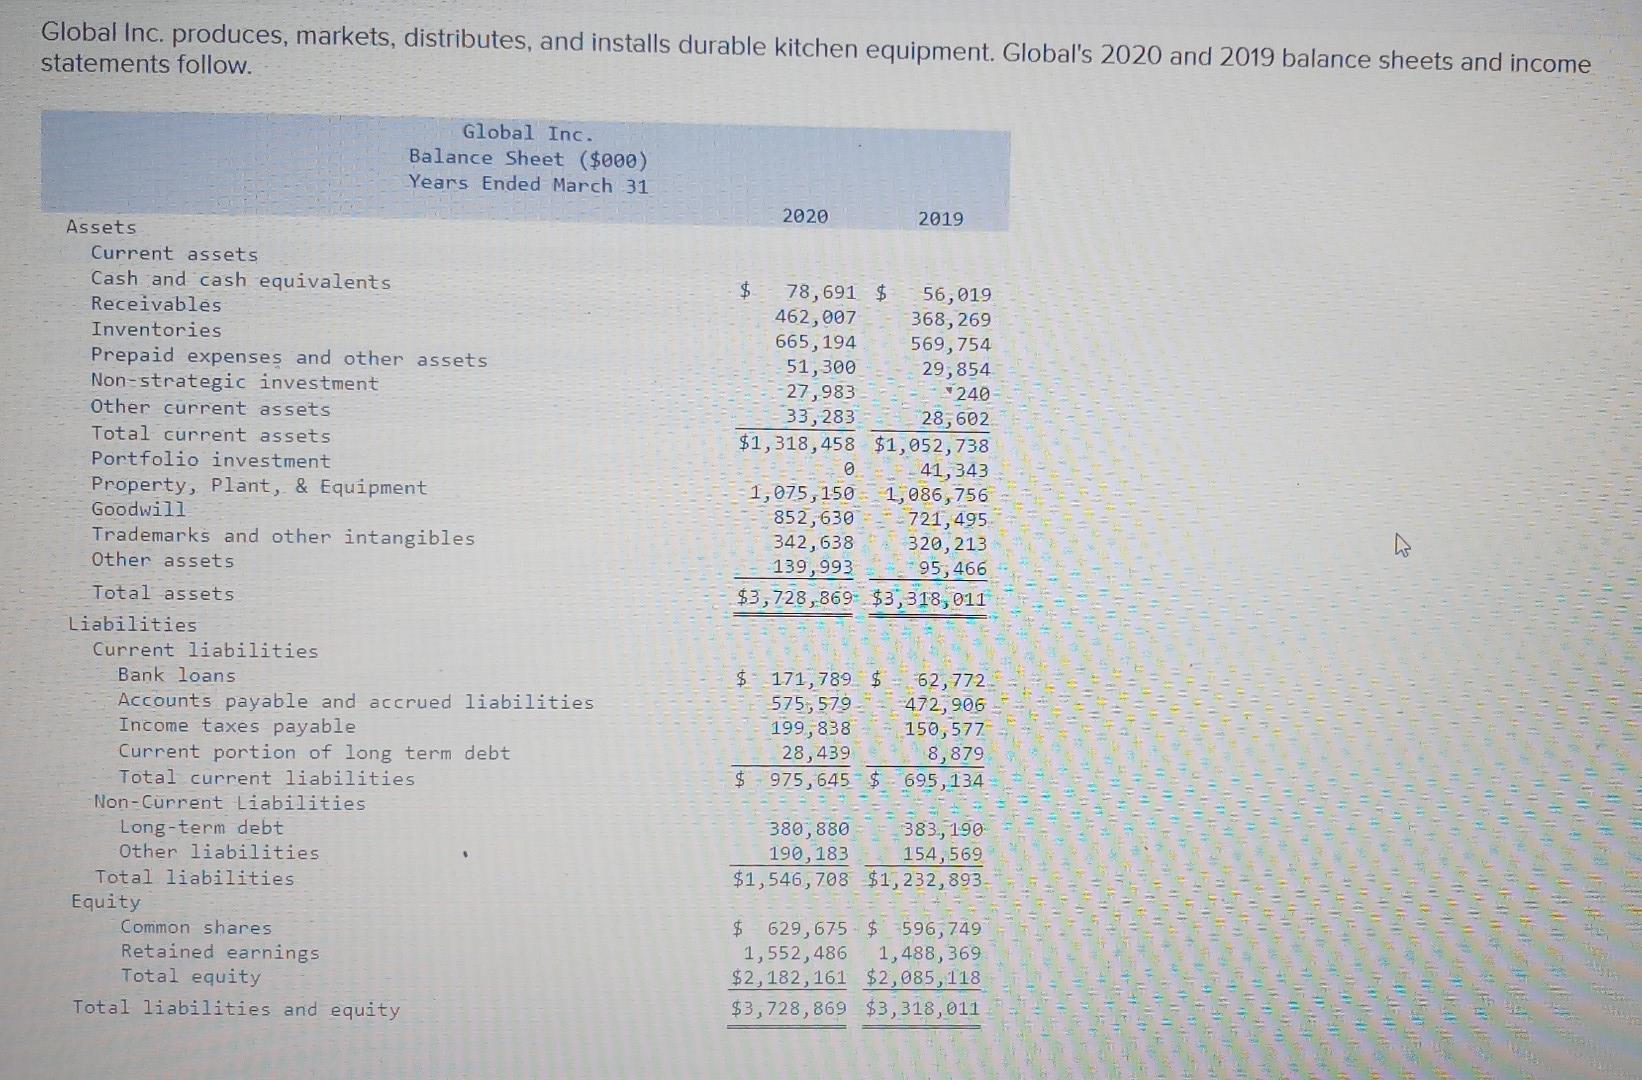
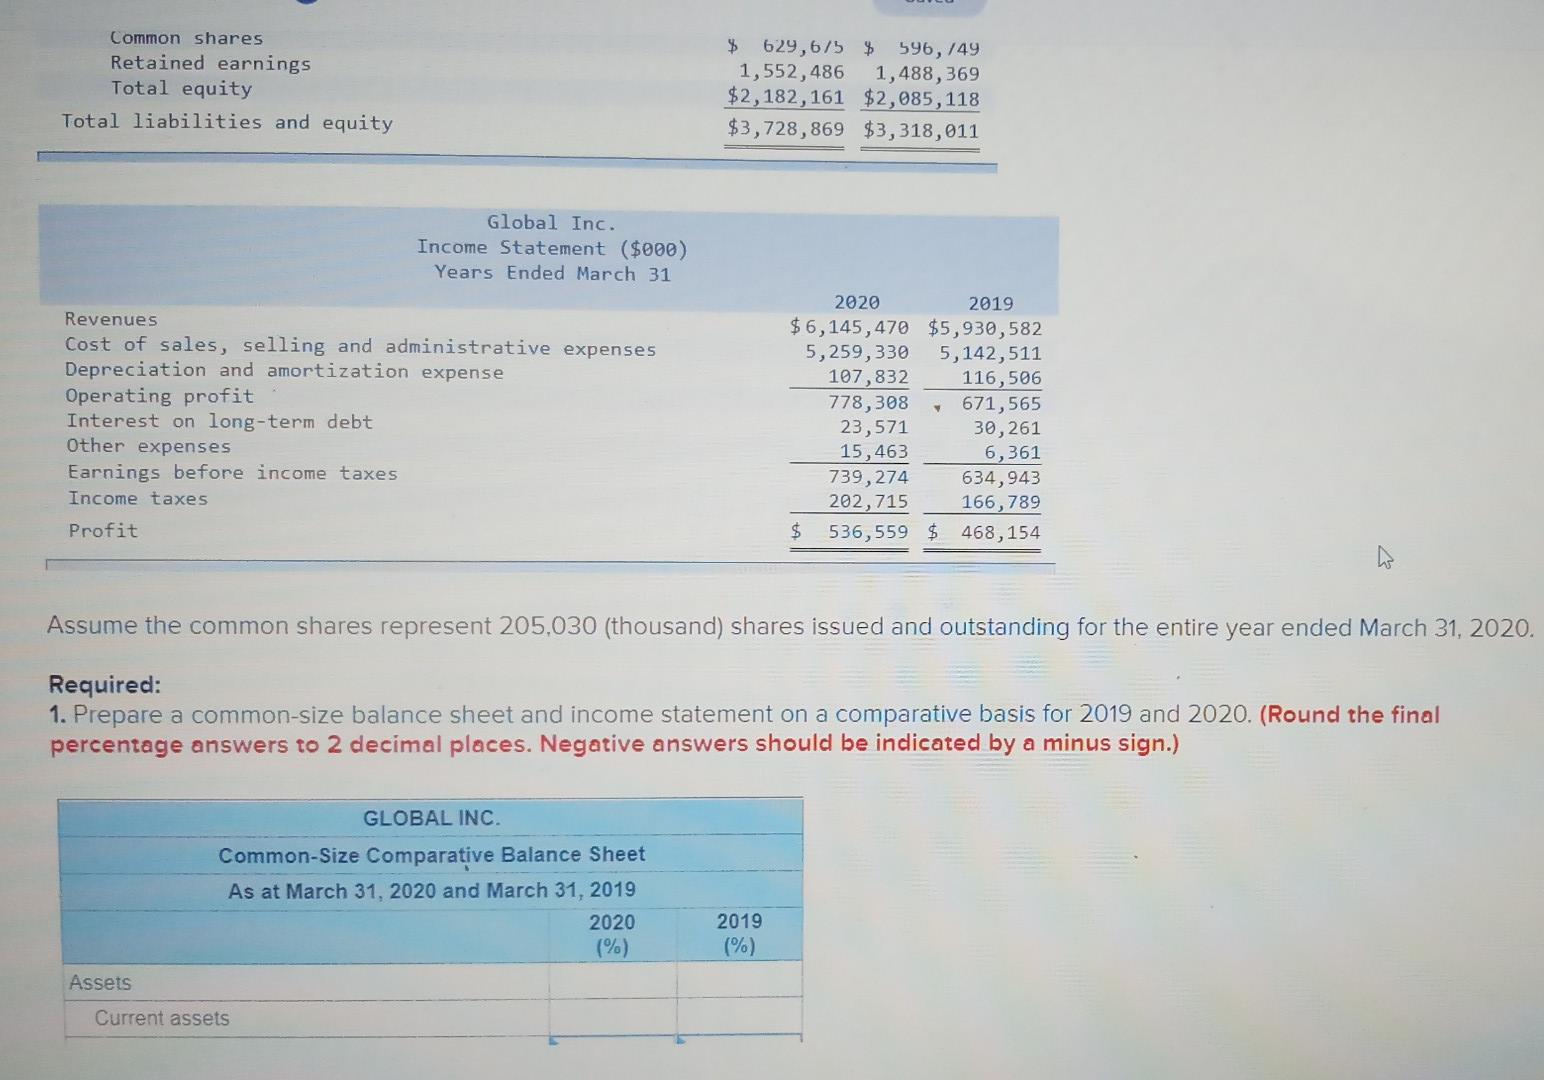
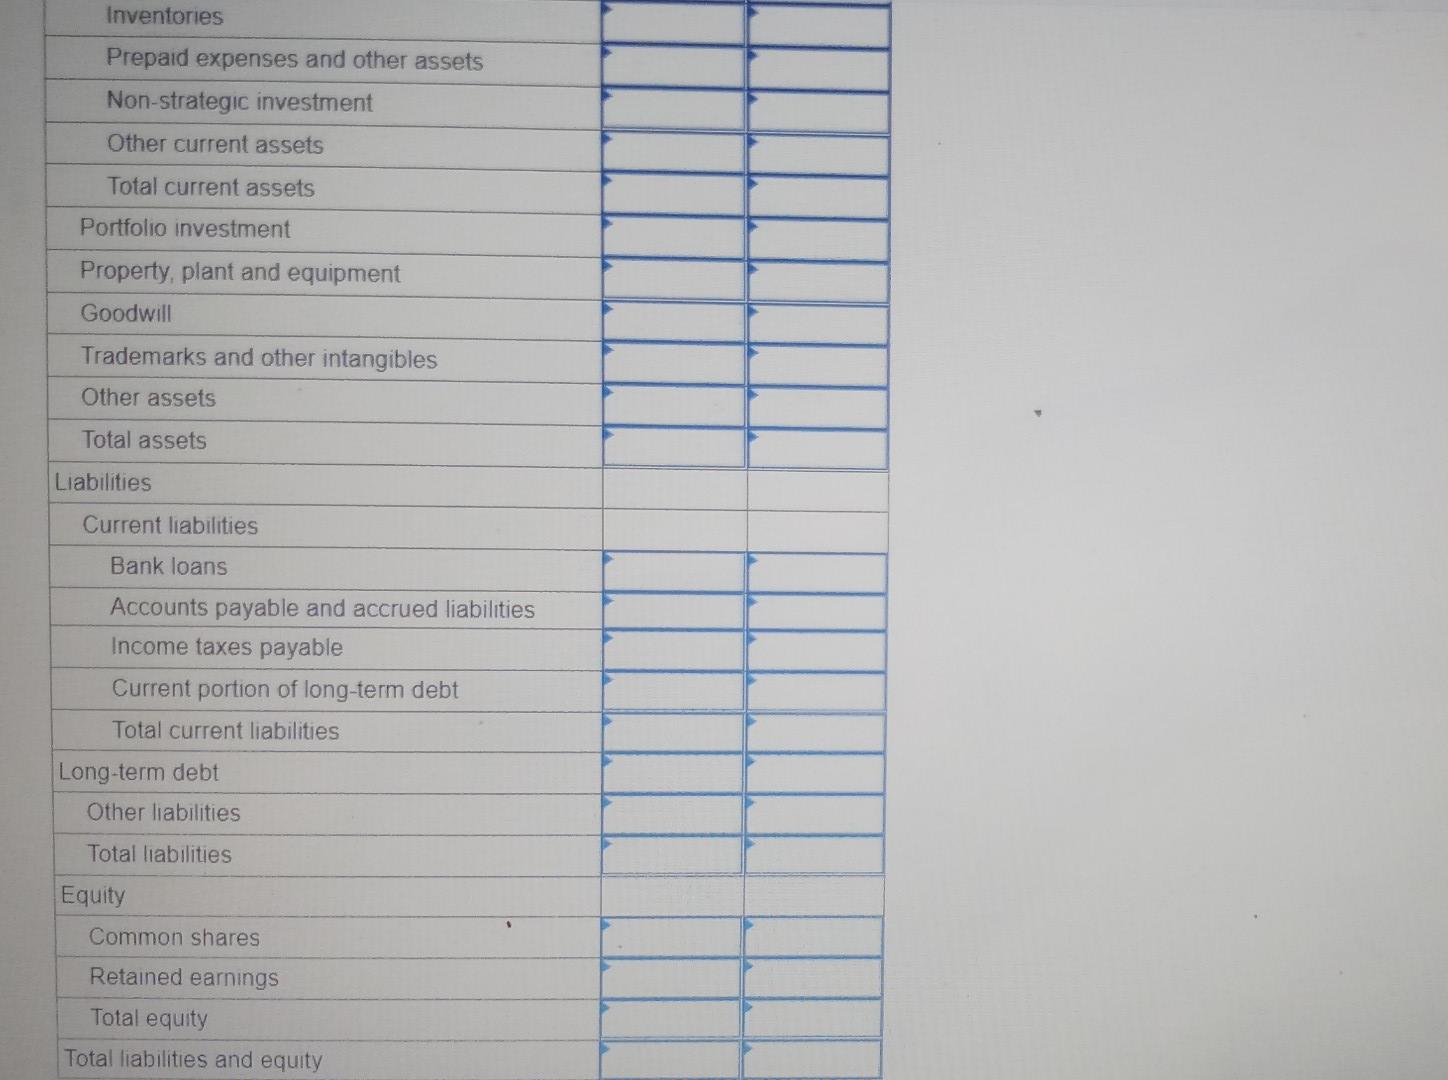
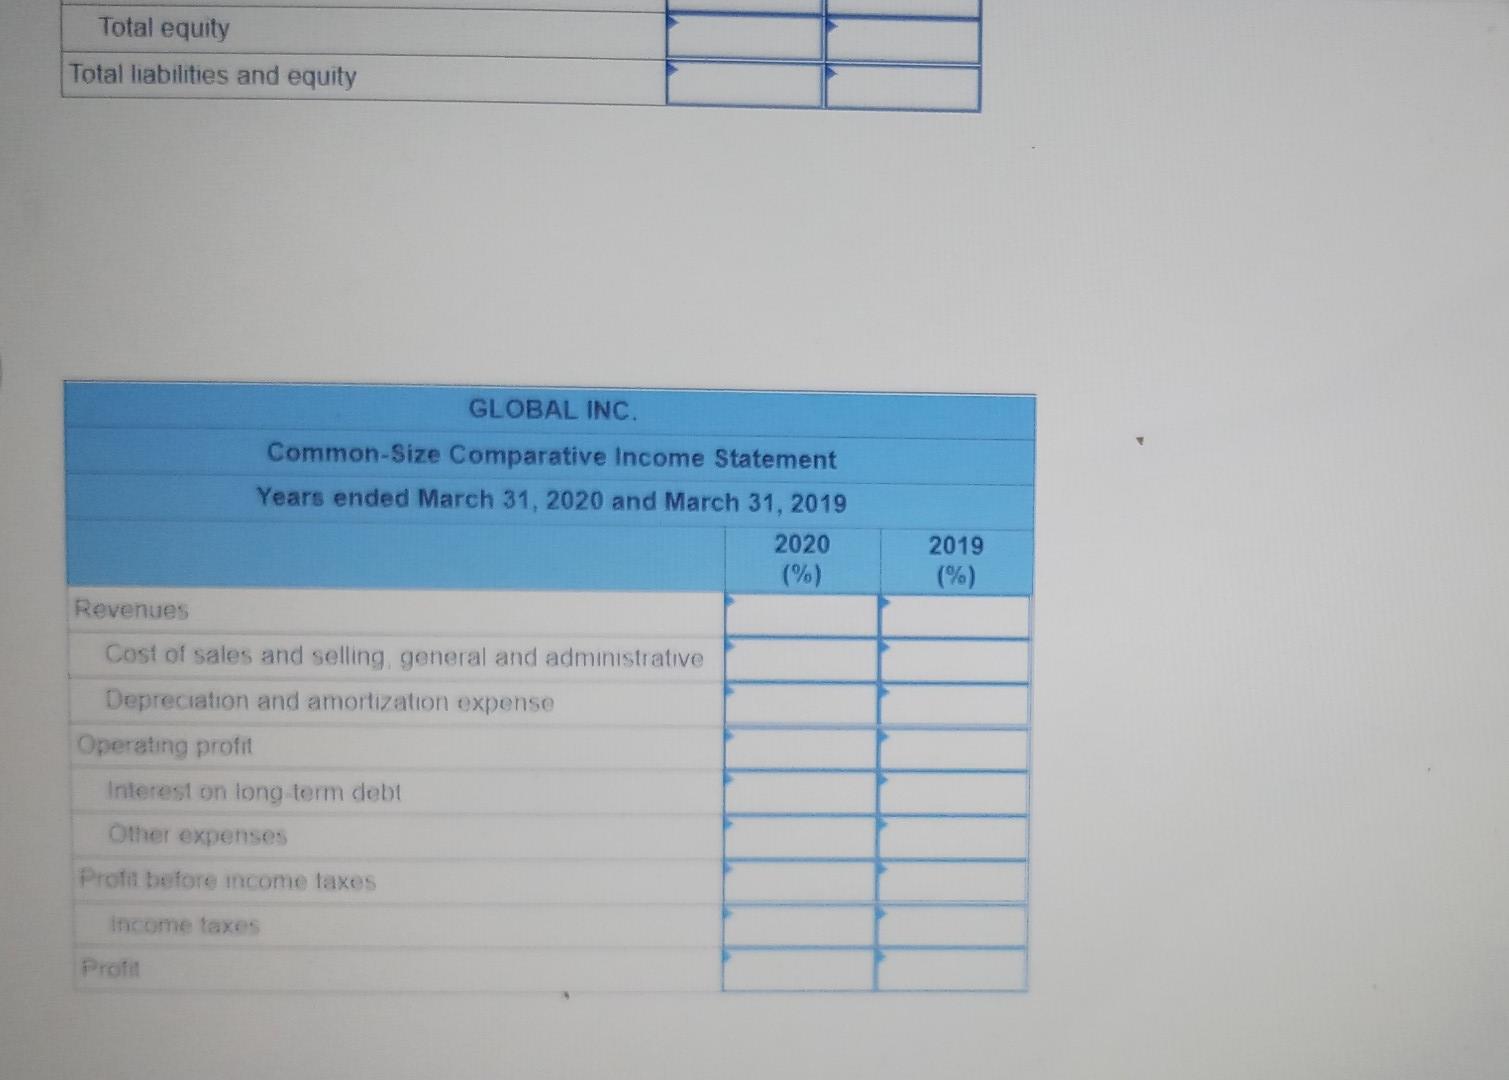
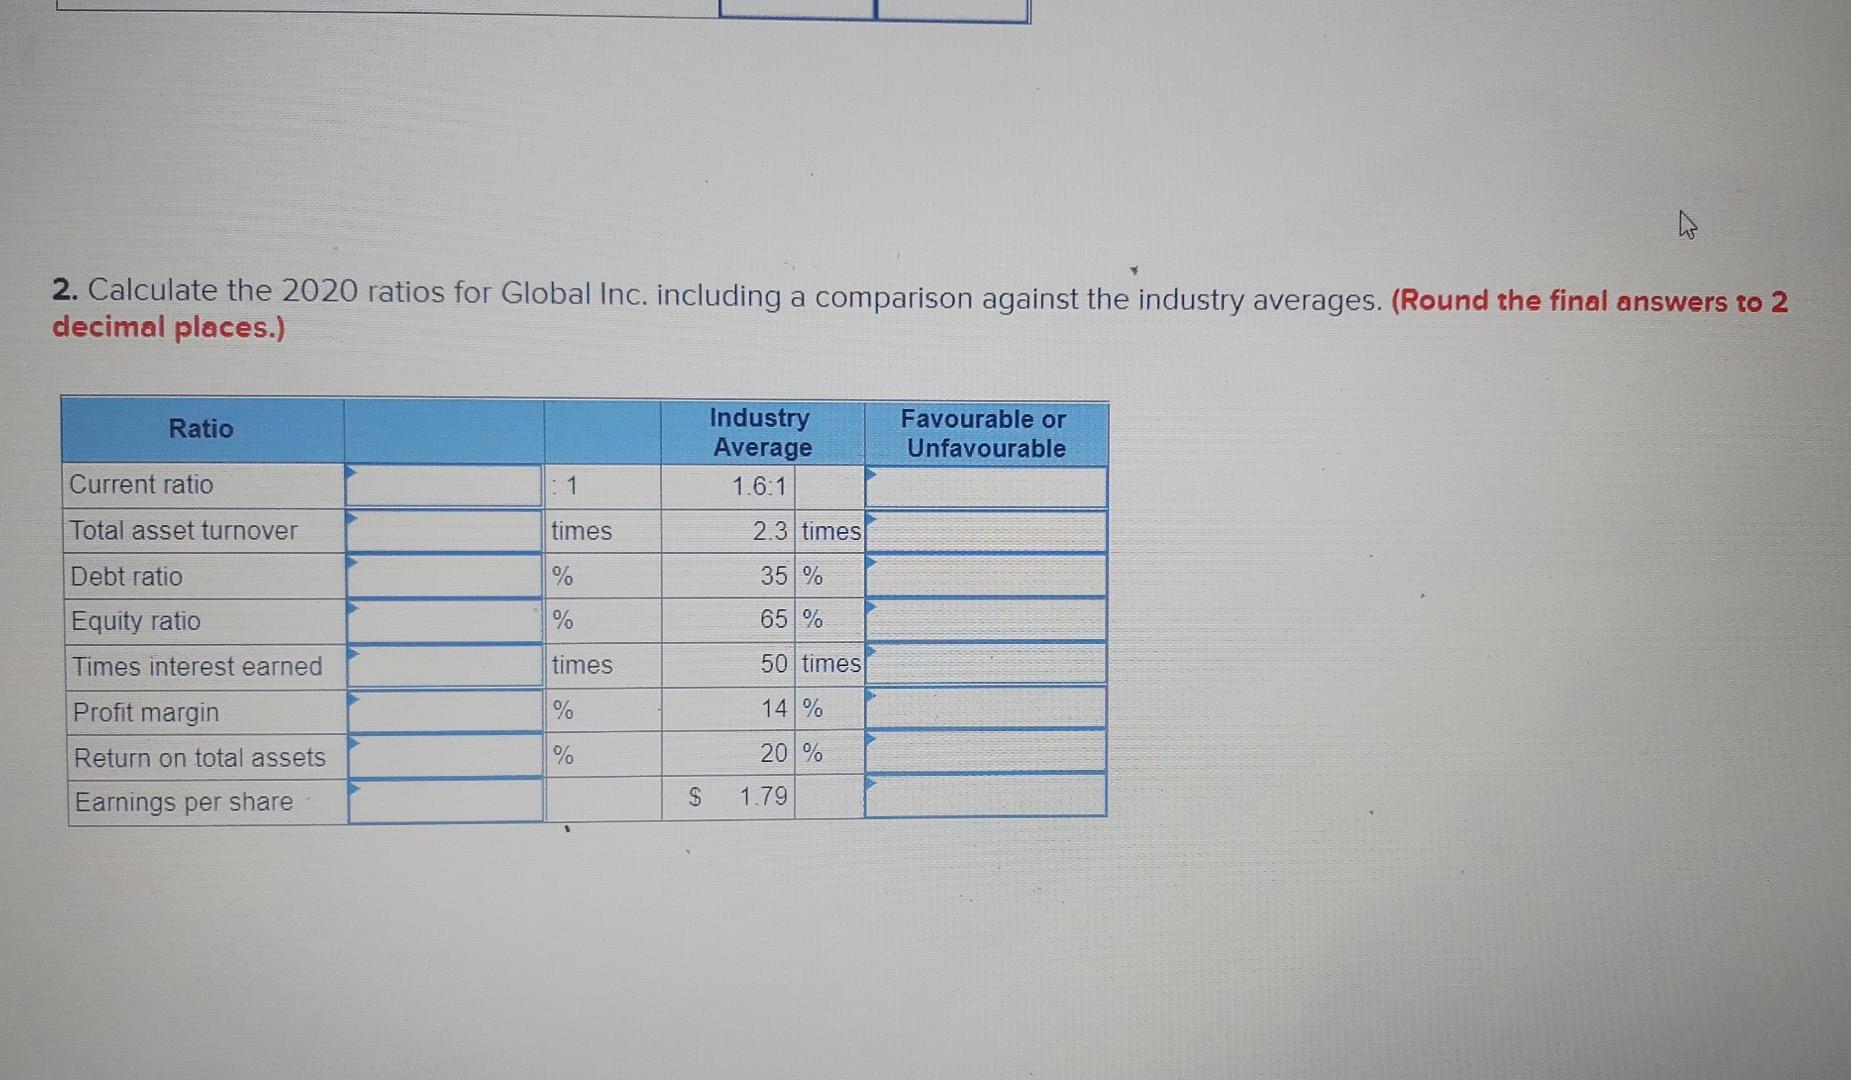
Global Inc. produces, markets, distributes, and installs durable kitchen equipment. Global's 2020 and 2019 balance sheets and income statements follow. Global Inc. Balance Sheet ($000) Years Ended March 31 2020 2019 $ 78,691 $ 56,019 462,007 368,269 665,194 569,754 51,300 29,854 27,983 240 33,283 28,602 $1,318,458 $1,052,738 41,343 1,075,150 1,086,756 852,630 -721,495 342,638 320,213 139,993 95,466 $3,728,869 $3,318, 011 Assets Current assets Cash and cash equivalents Receivables Inventories Prepaid expenses and other assets Non-strategic investment Other current assets Total current assets Portfolio investment Property, Plant, & Equipment Goodwill Trademarks and other intangibles Other assets Total assets Liabilities Current liabilities Bank loans Accounts payable and accrued liabilities Income taxes payable Current portion of long term debt Total current liabilities Non-Current Liabilities Long-term debt Other liabilities Total liabilities Equity Common shares Retained earnings Total equity Total liabilities and equity $ 171,789 $ = 62,772 575, 579 472,906 199,838 150,577 28,439 8,879 $ 975,645 $ 695,134 380,880 383., 190 190, 183 154,569 $1,546,708 $1,232,893 $ 629,675 $ 596,749 1,552,486 1,488,369 $2,182,161 $2,085, 118 $3,728,869 $3,318,011 Common shares Retained earnings Total equity Total liabilities and equity $ 629,6/5 $ 596,149 1,552,486 1,488,369 $2,182,161 $2,085, 118 $3,728,869 $3,318,011 Global Inc. Income Statement ($000) Years Ended March 31 Revenues Cost of sales, selling and administrative expenses Depreciation and amortization expense Operating profit Interest on long-term debt Other expenses Earnings before income taxes Income taxes Profit 2020 2019 $6,145,470 $5,930,582 5,259,330 5,142,511 107,832 116,506 778, 308 671,565 23,571 30,261 15,463 6,361 739, 274 634,943 202,715 166,789 $ 536,559 $ 468,154 ho Assume the common shares represent 205,030 (thousand) shares issued and outstanding for the entire year ended March 31, 2020. Required: 1. Prepare a common-size balance sheet and income statement on a comparative basis for 2019 and 2020. (Round the final percentage answers to 2 decimal places. Negative answers should be indicated by a minus sign.) GLOBAL INC. Common-Size Comparative Balance Sheet As at March 31, 2020 and March 31, 2019 2020 (%) 2019 (%) Assets Current assets Inventories Prepaid expenses and other assets Non-strategic investment Other current assets Total current assets Portfolio investment Property, plant and equipment Goodwill Trademarks and other intangibles Other assets Total assets Liabilities Current liabilities Bank loans Accounts payable and accrued liabilities Income taxes payable Current portion of long-term debt Total current liabilities Long-term debt Other liabilities Total liabilities Equity Common shares Retained earnings Total equity Total liabilities and equity Total equity Total liabilities and equity GLOBAL INC. Common-Size Comparative Income Statement Years ended March 31, 2020 and March 31, 2019 2020 (%) 2019 (%) Revenues Cost of sales and selling general and administrative Depreciation and amortization expense Operating profit Interest on long term debt Other expenses Profit before income taxes lcome taxes Profil 2. Calculate the 2020 ratios for Global Inc. including a comparison against the industry averages. (Round the final answers to 2 decimal places.) Ratio Industry Average 1.6:1 Favourable or Unfavourable Current ratio : 1 Total asset turnover times 2.3 times Debt ratio % 35 % Equity ratio % 65 % Times interest earned times 50 times Profit margin % 14 % Return on total assets % 20 % Earnings per share $ 1.79
Step by Step Solution
There are 3 Steps involved in it
Step: 1

Get Instant Access to Expert-Tailored Solutions
See step-by-step solutions with expert insights and AI powered tools for academic success
Step: 2

Step: 3
Ace Your Homework with AI
Get the answers you need in no time with our AI-driven, step-by-step assistance
Get Started
Working Papers Chapters 1 14 For Warren Jones Tayler S Financial And Managerial Accounting
Authors: Carl S. Warren ,Jefferson P. Jones ,William Tayler
16th Edition
0357714113, 978-0357714119