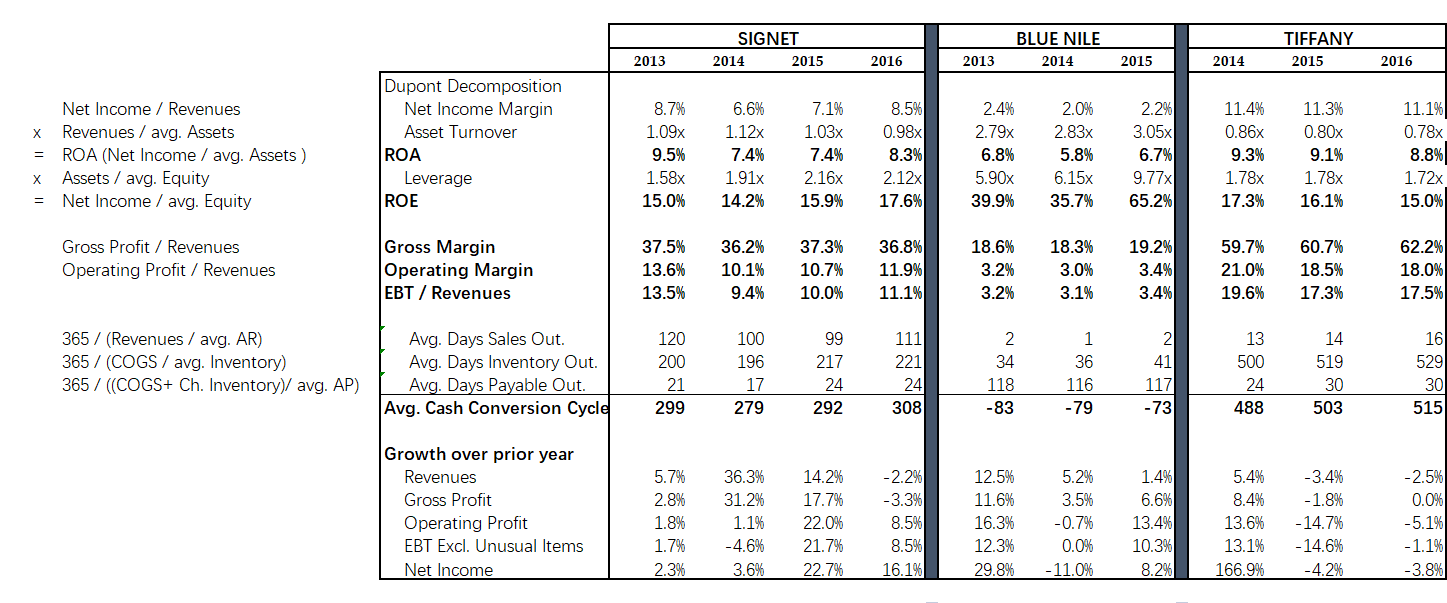
Go through the cash conversion cycle calculations in the spreadsheet. What are the similarities and differences for each of the companies?

SIGNET 2014 2015 BLUE NILE 2014 TIFFANY 2015 2013 2016 2013 2015 2014 2016 Net Income / Revenues x Revenues / avg. Assets ROA (Net Income / avg. Assets) x Assets / avg. Equity Net Income / avg. Equity Dupont Decomposition Net Income Margin Asset Turnover ROA Leverage ROE = 8.7% 1.09x 9.5% 1.58x 15.0% 6.6% 1.12x 7.4% 1.91x 14.2% 7.1% 1.03x 7.4% 2.16x 15.9% 8.5% 0.98x 8.3% 2.12x 17.6% 2.4% 2.79x 6.8% 5.90x 39.9% 2.0% 2.83x 5.8% 6.15x 35.7% 2.2% 3.05x 6.7% 9.77x 65.2% 11.4% 0.86x 9.3% 1.78x 17.3% 11.3% 0.80x 9.1% 1.78x 16.1% 11.1% 0.78x 8.8% 1.72x 15.0% = = Gross Profit / Revenues Operating Profit/ Revenues Gross Margin Operating Margin EBT / Revenues 37.5% 13.6% 13.5% 36.2% 10.1% 9.4% 37.3% 10.7% 10.0% 36.8% 11.9% 11.1% 18.6% 3.2% 3.2% 18.3% 3.0% 3.1% 19.2% 3.4% 3.4% 59.7% 21.0% 19.6% 60.7% 18.5% 17.3% 62.2% 18.0% 17.5% 365 / (Revenues / avg. AR) 365 / (COGS / avg. Inventory) 365 / (COGS+ Ch. Inventory) avg. AP) Avg. Days Sales Out. Avg. Days Inventory Out. Avg. Days Payable Out. Avg. Cash Conversion Cycle 120 200 21 299 100 196 17 279 99 217 24 292 111 221 24 308 2 34 118 -83 1 36 116 -79 2 41 117 -73 13 500 24 488 14 519 30 503 16 529 30 515 Growth over prior year Revenues Gross Profit Operating Profit EBT Excl. Unusual Items Net Income 5.7% 2.8% 1.8% 1.7% 2.3% 36.3% 31.2% 1.1% -4.6% 3.6% 14.2% 17.7% 22.0% 21.7% 22.7% -2.2% -3.3% 8.5% 8.5% 16.1% 12.5% 11.6% 16.3% 12.3% 29.8% 5.2% 3.5% -0.7% 0.0% -11.0% 1.4% 6.6% 13.4% 10.3% 8.2% 5.4% 8.4% 13.6% 13.1% 166.9% -3.4% -1.8% -14.7% - 14.6% -4.2% -2.5% 0.0% -5.1% - 1.1% -3.8% SIGNET 2014 2015 BLUE NILE 2014 TIFFANY 2015 2013 2016 2013 2015 2014 2016 Net Income / Revenues x Revenues / avg. Assets ROA (Net Income / avg. Assets) x Assets / avg. Equity Net Income / avg. Equity Dupont Decomposition Net Income Margin Asset Turnover ROA Leverage ROE = 8.7% 1.09x 9.5% 1.58x 15.0% 6.6% 1.12x 7.4% 1.91x 14.2% 7.1% 1.03x 7.4% 2.16x 15.9% 8.5% 0.98x 8.3% 2.12x 17.6% 2.4% 2.79x 6.8% 5.90x 39.9% 2.0% 2.83x 5.8% 6.15x 35.7% 2.2% 3.05x 6.7% 9.77x 65.2% 11.4% 0.86x 9.3% 1.78x 17.3% 11.3% 0.80x 9.1% 1.78x 16.1% 11.1% 0.78x 8.8% 1.72x 15.0% = = Gross Profit / Revenues Operating Profit/ Revenues Gross Margin Operating Margin EBT / Revenues 37.5% 13.6% 13.5% 36.2% 10.1% 9.4% 37.3% 10.7% 10.0% 36.8% 11.9% 11.1% 18.6% 3.2% 3.2% 18.3% 3.0% 3.1% 19.2% 3.4% 3.4% 59.7% 21.0% 19.6% 60.7% 18.5% 17.3% 62.2% 18.0% 17.5% 365 / (Revenues / avg. AR) 365 / (COGS / avg. Inventory) 365 / (COGS+ Ch. Inventory) avg. AP) Avg. Days Sales Out. Avg. Days Inventory Out. Avg. Days Payable Out. Avg. Cash Conversion Cycle 120 200 21 299 100 196 17 279 99 217 24 292 111 221 24 308 2 34 118 -83 1 36 116 -79 2 41 117 -73 13 500 24 488 14 519 30 503 16 529 30 515 Growth over prior year Revenues Gross Profit Operating Profit EBT Excl. Unusual Items Net Income 5.7% 2.8% 1.8% 1.7% 2.3% 36.3% 31.2% 1.1% -4.6% 3.6% 14.2% 17.7% 22.0% 21.7% 22.7% -2.2% -3.3% 8.5% 8.5% 16.1% 12.5% 11.6% 16.3% 12.3% 29.8% 5.2% 3.5% -0.7% 0.0% -11.0% 1.4% 6.6% 13.4% 10.3% 8.2% 5.4% 8.4% 13.6% 13.1% 166.9% -3.4% -1.8% -14.7% - 14.6% -4.2% -2.5% 0.0% -5.1% - 1.1% -3.8%


