go to the website to download the data on the monthly series for retail gasoline price and lagged crude oil prices 
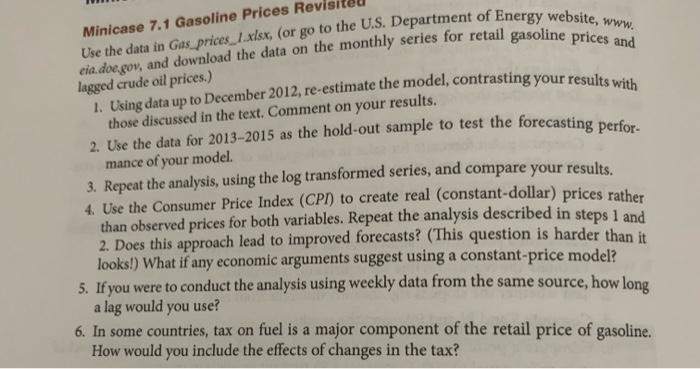
Minicase 7.1 Gasoline Prices Rev Use the data in Gasprices/.xlsx, (or go to the U.S. Department of Energy website, www. eia.doe gov, and download the data on the monthly series for retail gasoline prices and lagged crude oil prices.) 1. Using data up to December 2012, re-estimate the model, contrasting your results with those discussed in the text. Comment on your results. 2. Use the data for 2013-2015 as the hold-out sample to test the forecasting perfor- mance of your model 3. Repeat the analysis, using the log transformed series, and compare your results. 4. Use the Consumer Price Index (CPI) to create real (constant-dollar) prices rather than observed prices for both variables. Repeat the analysis described in steps 1 and 2. Does this approach lead to improved forecasts? (This question is harder than it looks!) What if any economic arguments suggest using a constant-price model? 5. If you were to conduct the analysis using weekly data from the same source, how long a lag would you use? 6. In some countries, tax on fuel is a major component of the retail price of gasoline. How would you include the effects of changes in the tax? Minicase 7.1 Gasoline Prices Rev Use the data in Gasprices/.xlsx, (or go to the U.S. Department of Energy website, www. eia.doe gov, and download the data on the monthly series for retail gasoline prices and lagged crude oil prices.) 1. Using data up to December 2012, re-estimate the model, contrasting your results with those discussed in the text. Comment on your results. 2. Use the data for 2013-2015 as the hold-out sample to test the forecasting perfor- mance of your model 3. Repeat the analysis, using the log transformed series, and compare your results. 4. Use the Consumer Price Index (CPI) to create real (constant-dollar) prices rather than observed prices for both variables. Repeat the analysis described in steps 1 and 2. Does this approach lead to improved forecasts? (This question is harder than it looks!) What if any economic arguments suggest using a constant-price model? 5. If you were to conduct the analysis using weekly data from the same source, how long a lag would you use? 6. In some countries, tax on fuel is a major component of the retail price of gasoline. How would you include the effects of changes in the tax


