Going Global with CAPABLE JUICE
You are the CMO (Chief Marketing Officer) for CAPABLE JUICE. CAPABLE JUICE is a company that sells a line of premium, all-natural juices. CAPABLE JUICE is marketed as a tasty beverage particularly well-suited for people who emphasize health and wellness in their lives. To date, your company has only sold in the Country C, but you are now preparing to make your first expansion into a foreign market.
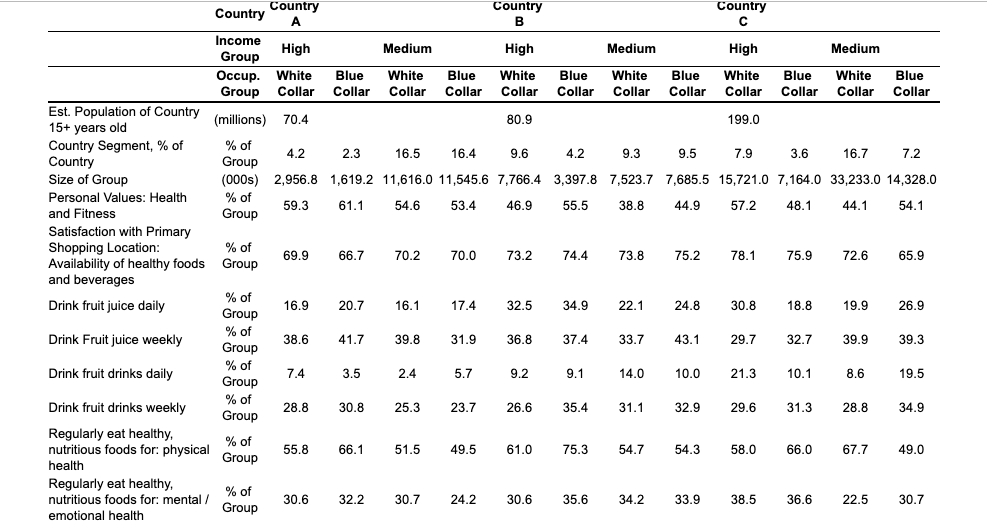
Previous research has narrowed the candidate countries down to three. Regardless of which country is selected, it has already been determined that CAPABLE JUICE will be sold to local distributors who will then be responsible for selling to local retailers and, ultimately, consumers. Your Chief Financial Officer (CFO) has provided you some preliminary financial information, and you have also been handed a report created from the GfK Consumer Trends Global Consumer Survey. This survey reports information about each country. Importantly, it dives deeper and also segments consumers by their relative income and occupational status. In the Country C, income and occupation have been important characteristics to identify CAPABLE JUICE consumers.
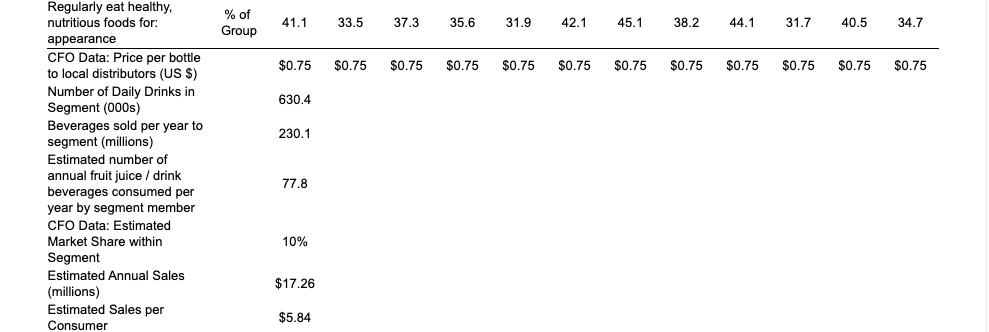
Review the data from the CFO and from the GfK consumer report. Then, make some preliminary financial estimates about the likely financial performance of CAPABLE JUICE. Based on your estimates, make some preliminary recommendations for CAPABLE JUICE's future international expansion.


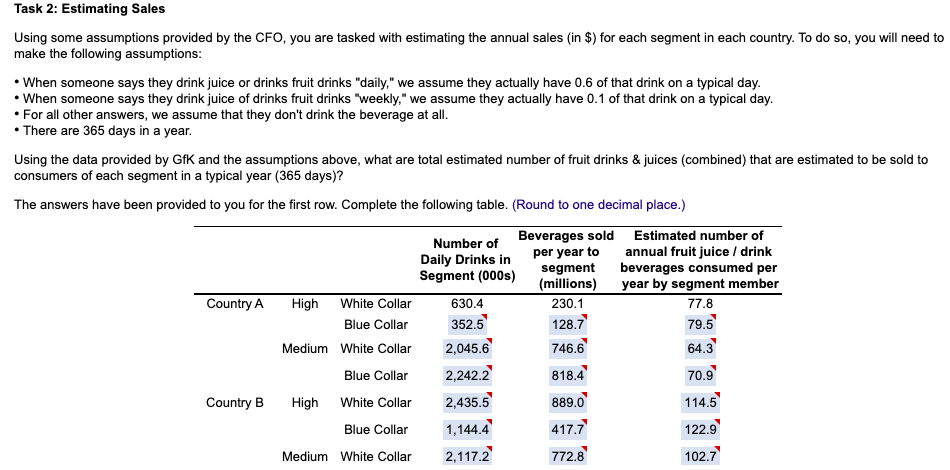
Country Country Country Country A B Income High Medium High Medium Group High Medium Occup. White Blue White Blue White Blue White Blue White Blue White Blue Group Collar Collar Collar Collar Collar Collar Collar Collar Collar Collar Collar Collar Est. Population of Country 80.9 (millions) 70.4 199.0 15+ years old Country Segment, % of % of 4.2 2.3 16.5 16.4 9.6 4.2 9.3 9.5 7.9 3.6 16.7 Country 7.2 Group Size of Group (000s) 2,956.8 1,619.2 11,616.0 11,545.6 7,766.4 3,397.8 7,523.7 7,685.5 15,721.0 7,164.0 33,233.0 14,328.0 Personal Values: Health % of 59.3 61.1 54.6 53.4 46.9 55.5 38.8 44.9 57.2 48.1 44.1 54.1 and Fitness Group Satisfaction with Primary Shopping Location: % of 69.9 66.7 70.2 70.0 73.2 74.4 73.8 75.2 78.1 75.9 72.6 65.9 Availability of healthy foods Group and beverages Drink fruit juice daily % of 16.9 20.7 16.1 17.4 32.5 34.9 22.1 24.8 30.8 18.8 19.9 26.9 Group % of Drink Fruit juice weekly 38.6 41.7 39.8 31.9 36.8 37.4 33.7 43.1 29.7 32.7 39.9 39.3 Group % of Drink fruit drinks daily 7.4 3.5 2.4 5.7 9.2 9.1 14.0 10.0 21.3 10.1 8.6 19.5 Group Drink fruit drinks weekly % of 28.8 30.8 25.3 23.7 26.6 35.4 31.1 32.9 29.6 31.3 28.8 34.9 Group Regularly eat healthy, % of nutritious foods for: physical 55.8 66.1 51.5 49.5 61.0 75.3 54.7 54.3 58.0 66.0 67.7 49.0 Group health Regularly eat healthy, % of nutritious foods for mental / 30.6 32.2 30.7 24.2 30.6 35.6 34.2 33.9 38.5 36.6 22.5 30.7 Group emotional health % of Group 41.1 33.5 37.3 35.6 31.9 42.1 45.1 38.2 44.1 31.7 40.5 34.7 $0.75 $0.75 $0.75 $0.75 $0.75 $0.75 $0.75 $0.75 $0.75 $0.75 $0.75 $0.75 630.4 Regularly eat healthy, nutritious foods for: appearance CFO Data: Price per bottle to local distributors (US$) Number of Daily Drinks in Segment (000s) Beverages sold per year to segment (millions) Estimated number of annual fruit juice / drink beverages consumed per year by segment member CFO Data: Estimated Market Share within 230.1 77.8 10% Segment $17.26 Estimated Annual Sales (millions) Estimated Sales per Consumer $5.84 Task 2: Estimating Sales Using some assumptions provided by the CFO, you are tasked with estimating the annual sales in $) for each segment in each country. To do so, you will need to make the following assumptions: When someone says they drink juice or drinks fruit drinks "daily," we assume they actually have 0.6 of that drink on a typical day. When someone says they drink juice of drinks fruit drinks "weekly," we assume they actually have 0.1 of that drink on a typical day. . For all other answers, we assume that they don't drink the beverage at all. There are 365 days in a year. Using the data provided by GfK and the assumptions above, what are total estimated number of fruit drinks & juices (combined) that are estimated to be sold to consumers of each segment in a typical year (365 days)? The answers have been provided to you for the first row. Complete the following table. (Round to one decimal place.) Country A 352.5 79.5 High White Collar Blue Collar Medium White Collar Blue Collar High White Collar Blue Collar Medium White Collar Beverages sold Number of Estimated number of Daily Drinks in per year to annual fruit juice / drink segment Segment (000s) beverages consumed per (millions) year by segment member 630.4 230.1 77.8 128.7 2,045.6 746.6 64.3 2,242.2 818.4 70.9 2,435.5 889.0 1,144.4 417.7 122.9 2,117.2 772.8 102.7 Country B 114.5 X One or more of your responses is incorrect. At least one of your answers is incorrect. Use the following relationships to calculate the required values. Estimated units sold per segment per year = 2 (Segment Total Size)x (% daily drink) x (Assumed daily consumption) X365, Li= 1 Average yearly consumption per consumer = [Estimated units sold per segment per year]/[Total size of segment]. OK Country Country Country Country A B Income High Medium High Medium Group High Medium Occup. White Blue White Blue White Blue White Blue White Blue White Blue Group Collar Collar Collar Collar Collar Collar Collar Collar Collar Collar Collar Collar Est. Population of Country 80.9 (millions) 70.4 199.0 15+ years old Country Segment, % of % of 4.2 2.3 16.5 16.4 9.6 4.2 9.3 9.5 7.9 3.6 16.7 Country 7.2 Group Size of Group (000s) 2,956.8 1,619.2 11,616.0 11,545.6 7,766.4 3,397.8 7,523.7 7,685.5 15,721.0 7,164.0 33,233.0 14,328.0 Personal Values: Health % of 59.3 61.1 54.6 53.4 46.9 55.5 38.8 44.9 57.2 48.1 44.1 54.1 and Fitness Group Satisfaction with Primary Shopping Location: % of 69.9 66.7 70.2 70.0 73.2 74.4 73.8 75.2 78.1 75.9 72.6 65.9 Availability of healthy foods Group and beverages Drink fruit juice daily % of 16.9 20.7 16.1 17.4 32.5 34.9 22.1 24.8 30.8 18.8 19.9 26.9 Group % of Drink Fruit juice weekly 38.6 41.7 39.8 31.9 36.8 37.4 33.7 43.1 29.7 32.7 39.9 39.3 Group % of Drink fruit drinks daily 7.4 3.5 2.4 5.7 9.2 9.1 14.0 10.0 21.3 10.1 8.6 19.5 Group Drink fruit drinks weekly % of 28.8 30.8 25.3 23.7 26.6 35.4 31.1 32.9 29.6 31.3 28.8 34.9 Group Regularly eat healthy, % of nutritious foods for: physical 55.8 66.1 51.5 49.5 61.0 75.3 54.7 54.3 58.0 66.0 67.7 49.0 Group health Regularly eat healthy, % of nutritious foods for mental / 30.6 32.2 30.7 24.2 30.6 35.6 34.2 33.9 38.5 36.6 22.5 30.7 Group emotional health % of Group 41.1 33.5 37.3 35.6 31.9 42.1 45.1 38.2 44.1 31.7 40.5 34.7 $0.75 $0.75 $0.75 $0.75 $0.75 $0.75 $0.75 $0.75 $0.75 $0.75 $0.75 $0.75 630.4 Regularly eat healthy, nutritious foods for: appearance CFO Data: Price per bottle to local distributors (US$) Number of Daily Drinks in Segment (000s) Beverages sold per year to segment (millions) Estimated number of annual fruit juice / drink beverages consumed per year by segment member CFO Data: Estimated Market Share within 230.1 77.8 10% Segment $17.26 Estimated Annual Sales (millions) Estimated Sales per Consumer $5.84 Task 2: Estimating Sales Using some assumptions provided by the CFO, you are tasked with estimating the annual sales in $) for each segment in each country. To do so, you will need to make the following assumptions: When someone says they drink juice or drinks fruit drinks "daily," we assume they actually have 0.6 of that drink on a typical day. When someone says they drink juice of drinks fruit drinks "weekly," we assume they actually have 0.1 of that drink on a typical day. . For all other answers, we assume that they don't drink the beverage at all. There are 365 days in a year. Using the data provided by GfK and the assumptions above, what are total estimated number of fruit drinks & juices (combined) that are estimated to be sold to consumers of each segment in a typical year (365 days)? The answers have been provided to you for the first row. Complete the following table. (Round to one decimal place.) Country A 352.5 79.5 High White Collar Blue Collar Medium White Collar Blue Collar High White Collar Blue Collar Medium White Collar Beverages sold Number of Estimated number of Daily Drinks in per year to annual fruit juice / drink segment Segment (000s) beverages consumed per (millions) year by segment member 630.4 230.1 77.8 128.7 2,045.6 746.6 64.3 2,242.2 818.4 70.9 2,435.5 889.0 1,144.4 417.7 122.9 2,117.2 772.8 102.7 Country B 114.5 X One or more of your responses is incorrect. At least one of your answers is incorrect. Use the following relationships to calculate the required values. Estimated units sold per segment per year = 2 (Segment Total Size)x (% daily drink) x (Assumed daily consumption) X365, Li= 1 Average yearly consumption per consumer = [Estimated units sold per segment per year]/[Total size of segment]. OK


