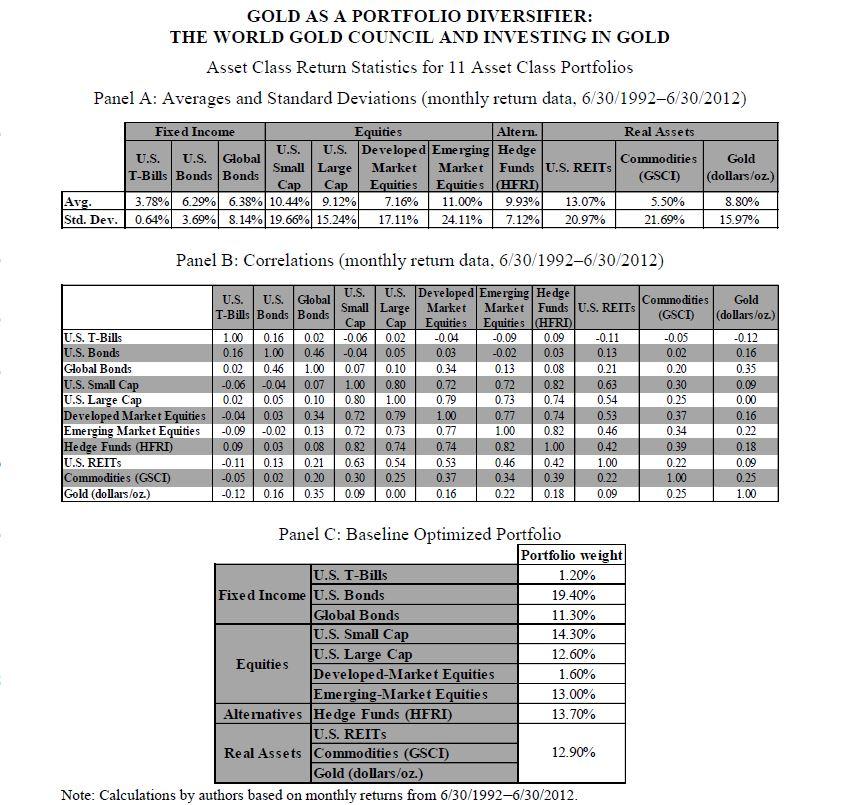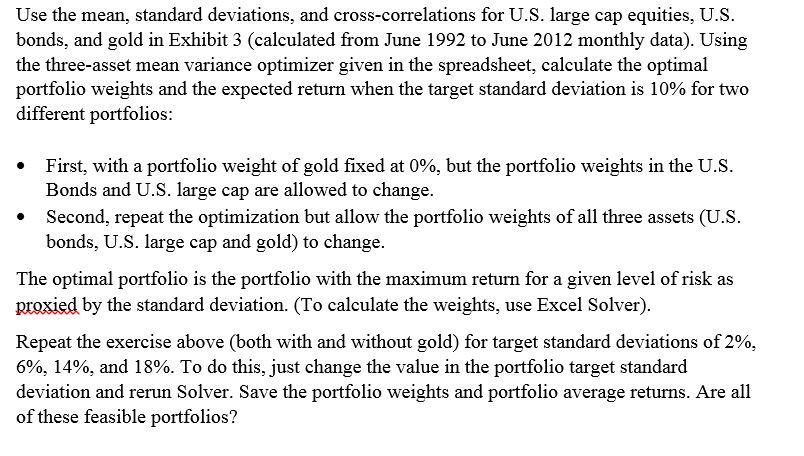

GOLD AS A PORTFOLIO DIVERSIFIER: THE WORLD GOLD COUNCIL AND INVESTING IN GOLD Asset Class Return Statistics for 11 Asset Class Portfolios Panel A: Averages and Standard Deviations (monthly return data, 6/30/19926/30/2012) Fixed Income Equities Altern. Real Assets U.S. U.S. Global U.S. Developed Emerging Hedge Commodities Small Large Market Market Gold Funds U.S. REITS T-Bills Bonds Bonds (GSCI) (dollars/oz) Cap Cap Equities Equities HERI Avg. 3.78% 6.29% 6.38% 10.44% 9.12% 7.16% 11.00% 13.07% 5.50% 8.80% Std. Dev. 0.64% 3.69% 8.14% 19.66% 15.24% 24.11% 7.12% 20.97% U.S. 9.93% 17.11% 21.69% 15.97% Panel B: Correlations (monthly return data, 6/30/19926/30/2012) U.S. U.S. U.S. Global U.S. Developed Emerging Hedge Commodities Gold T-Bills Bonds Bonds Small Large Market Market Funds U.S. REITS Cap Equities Equities HFRI) (GSCI) (dollars/oz.) U.S. T-Bills 1.00 0.16 0.02 -0.06 0.02 -0.04 -0.09 0.09 -0.11 -0.05 -0.12 U.S. Bonds 0.16 1.00 0.46 -0.04 0.05 0.03 -0.02 0.03 0.13 0.02 0.16 Global Bonds 0.02 0.46 1.00 0.07 0.10 0.34 0.13 0.08 0.21 0.20 0.35 U.S. Small Cap -0.06 -0.04 0.07 1.00 0.80 0.72 0.72 0.82 0.63 0.30 0.09 U.S. Large Cap 0.02 0.05 0.10 0.80 1.00 0.79 0.73 0.74 0.54 0.25 0.00 Developed Market Equities -0.04 0.03 0.34 0.72 0.79 1.00 0.77 0.74 0.53 0.37 0.16 Emerging Market Equities -0.09 -0.02 0.13 0.72 0.73 0.77 1.00 0.82 0.46 0.34 0.22 Hedge Funds (HFRI) 0.09 0.03 0.08 0.82 0.74 0.74 0.82 1.00 0.42 0.39 0.18 U.S. REITS -0.11 0.13 0.21 0.63 0.54 0.53 0.46 0.42 1.00 0.22 0.09 Commodities (GSCT) -0.05 0.02 0.20 0.30 0.25 0.37 0.34 0.39 0.22 1.00 0.25 Gold (dollars/oz.) -0.12 0.16 0.35 0.09 0.00 0.16 0.22 0.18 0.09 0.25 1.00 Panel C: Baseline Optimized Portfolio Portfolio weight U.S. T-Bills 1.20% Fixed Income U.S. Bonds 19.40% Global Bonds 11.30% U.S. Small Cap 14.30% U.S. Large Cap 12.60% Equities Developed-Market Equities 1.60% Emerging-Market Equities 13.00% Alternatives Hedge Funds (HFRI) 13.70% U.S. REITS Real Assets Commodities (GSCI) 12.90% Gold (dollars/oz.) Note: Calculations by authors based on monthly returns from 6/30/19926/30/2012. Use the mean, standard deviations, and cross-correlations for U.S. large cap equities, U.S. bonds, and gold in Exhibit 3 (calculated from June 1992 to June 2012 monthly data). Using the three-asset mean variance optimizer given in the spreadsheet, calculate the optimal portfolio weights and the expected return when the target standard deviation is 10% for two different portfolios: First, with a portfolio weight of gold fixed at 0%, but the portfolio weights in the U.S. Bonds and U.S. large cap are allowed to change. Second, repeat the optimization but allow the portfolio weights of all three assets (U.S. bonds, U.S. large cap and gold) to change. The optimal portfolio is the portfolio with the maximum return for a given level of risk as proxied by the standard deviation. (To calculate the weights, use Excel Solver). Repeat the exercise above (both with and without gold) for target standard deviations of 2%, 6%, 14%, and 18%. To do this, just change the value in the portfolio target standard deviation and rerun Solver. Save the portfolio weights and portfolio average returns. Are all of these feasible portfolios? GOLD AS A PORTFOLIO DIVERSIFIER: THE WORLD GOLD COUNCIL AND INVESTING IN GOLD Asset Class Return Statistics for 11 Asset Class Portfolios Panel A: Averages and Standard Deviations (monthly return data, 6/30/19926/30/2012) Fixed Income Equities Altern. Real Assets U.S. U.S. Global U.S. Developed Emerging Hedge Commodities Small Large Market Market Gold Funds U.S. REITS T-Bills Bonds Bonds (GSCI) (dollars/oz) Cap Cap Equities Equities HERI Avg. 3.78% 6.29% 6.38% 10.44% 9.12% 7.16% 11.00% 13.07% 5.50% 8.80% Std. Dev. 0.64% 3.69% 8.14% 19.66% 15.24% 24.11% 7.12% 20.97% U.S. 9.93% 17.11% 21.69% 15.97% Panel B: Correlations (monthly return data, 6/30/19926/30/2012) U.S. U.S. U.S. Global U.S. Developed Emerging Hedge Commodities Gold T-Bills Bonds Bonds Small Large Market Market Funds U.S. REITS Cap Equities Equities HFRI) (GSCI) (dollars/oz.) U.S. T-Bills 1.00 0.16 0.02 -0.06 0.02 -0.04 -0.09 0.09 -0.11 -0.05 -0.12 U.S. Bonds 0.16 1.00 0.46 -0.04 0.05 0.03 -0.02 0.03 0.13 0.02 0.16 Global Bonds 0.02 0.46 1.00 0.07 0.10 0.34 0.13 0.08 0.21 0.20 0.35 U.S. Small Cap -0.06 -0.04 0.07 1.00 0.80 0.72 0.72 0.82 0.63 0.30 0.09 U.S. Large Cap 0.02 0.05 0.10 0.80 1.00 0.79 0.73 0.74 0.54 0.25 0.00 Developed Market Equities -0.04 0.03 0.34 0.72 0.79 1.00 0.77 0.74 0.53 0.37 0.16 Emerging Market Equities -0.09 -0.02 0.13 0.72 0.73 0.77 1.00 0.82 0.46 0.34 0.22 Hedge Funds (HFRI) 0.09 0.03 0.08 0.82 0.74 0.74 0.82 1.00 0.42 0.39 0.18 U.S. REITS -0.11 0.13 0.21 0.63 0.54 0.53 0.46 0.42 1.00 0.22 0.09 Commodities (GSCT) -0.05 0.02 0.20 0.30 0.25 0.37 0.34 0.39 0.22 1.00 0.25 Gold (dollars/oz.) -0.12 0.16 0.35 0.09 0.00 0.16 0.22 0.18 0.09 0.25 1.00 Panel C: Baseline Optimized Portfolio Portfolio weight U.S. T-Bills 1.20% Fixed Income U.S. Bonds 19.40% Global Bonds 11.30% U.S. Small Cap 14.30% U.S. Large Cap 12.60% Equities Developed-Market Equities 1.60% Emerging-Market Equities 13.00% Alternatives Hedge Funds (HFRI) 13.70% U.S. REITS Real Assets Commodities (GSCI) 12.90% Gold (dollars/oz.) Note: Calculations by authors based on monthly returns from 6/30/19926/30/2012. Use the mean, standard deviations, and cross-correlations for U.S. large cap equities, U.S. bonds, and gold in Exhibit 3 (calculated from June 1992 to June 2012 monthly data). Using the three-asset mean variance optimizer given in the spreadsheet, calculate the optimal portfolio weights and the expected return when the target standard deviation is 10% for two different portfolios: First, with a portfolio weight of gold fixed at 0%, but the portfolio weights in the U.S. Bonds and U.S. large cap are allowed to change. Second, repeat the optimization but allow the portfolio weights of all three assets (U.S. bonds, U.S. large cap and gold) to change. The optimal portfolio is the portfolio with the maximum return for a given level of risk as proxied by the standard deviation. (To calculate the weights, use Excel Solver). Repeat the exercise above (both with and without gold) for target standard deviations of 2%, 6%, 14%, and 18%. To do this, just change the value in the portfolio target standard deviation and rerun Solver. Save the portfolio weights and portfolio average returns. Are all of these feasible portfolios


