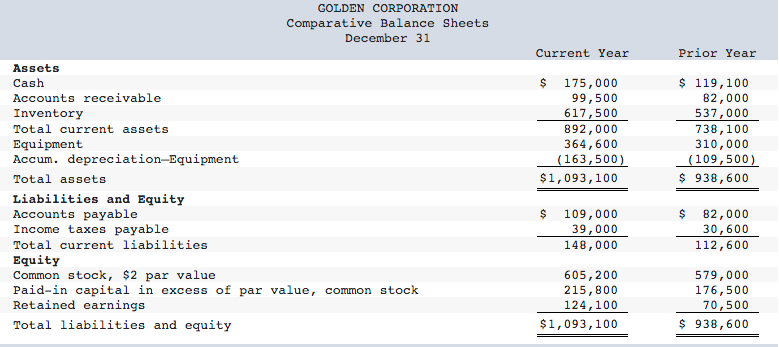
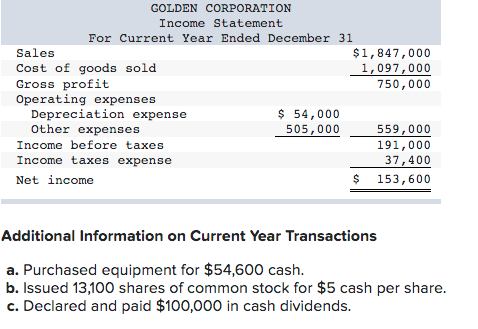
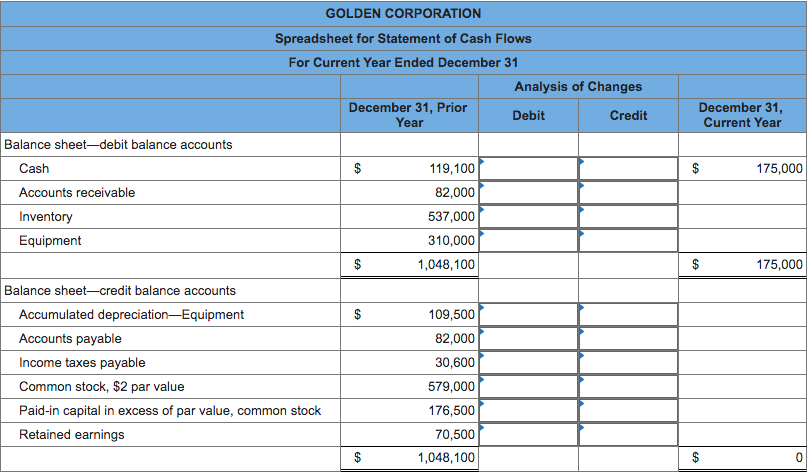
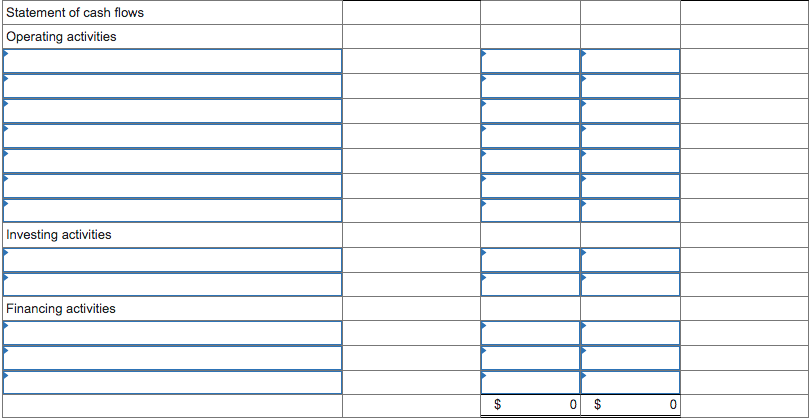
GOLDEN CORPORATION Comparative Balance Sheets December 31 Current Year Prior Year $ 175,000 99,500 617,500 892,000 364,600 (163,500) $1,093,100 $ 119,100 82,000 537,000 738,100 310,000 (109,500) $ 938, 600 Assets Cash Accounts receivable Inventory Total current assets Equipment Accum. depreciation-Equipment Total assets Liabilities and Equity Accounts payable Income taxes payable Total current liabilities Equity Common stock, $2 par value Paid-in capital in excess of par value, common stock Retained earnings Total liabilities and equity $ $ 109,000 39,000 148,000 82,000 30, 600 112,600 605,200 215,800 124,100 $1,093, 100 579,000 176,500 70,500 $ 938,600 GOLDEN CORPORATION Income Statement For Current Year Ended December 31 Sales $1,847,000 Cost of goods sold 1,097,000 Gross profit 750,000 Operating expenses Depreciation expense $ 54,000 Other expenses 505,000 559,000 Income before taxes 191,000 Income taxes expense 37,400 Net income $ 153,600 Additional Information on Current Year Transactions a. Purchased equipment for $54,600 cash. b. Issued 13,100 shares of common stock for $5 cash per share. c. Declared and paid $100,000 in cash dividends. GOLDEN CORPORATION Spreadsheet for Statement of Cash Flows For Current Year Ended December 31 Analysis of Changes December 31, Prior Debit Credit Year December 31, Current Year $ $ 175,000 Balance sheet-debit balance accounts Cash Accounts receivable Inventory Equipment 119,100 82,000 537,000 310,000 1,048,100 $ $ 175,000 Balance sheet-credit balance accounts Accumulated depreciation Equipment Accounts payable Income taxes payable Common stock, $2 par value Paid-in capital in excess of par value, common stock Retained earnings 109,500 82,000 30,600 579,000 176,500 70,500 1,048, 100 $ $ 0 Statement of cash flows Operating activities Investing activities Financing activities $ 0 $ 0 GOLDEN CORPORATION Comparative Balance Sheets December 31 Current Year Prior Year $ 175,000 99,500 617,500 892,000 364,600 (163,500) $1,093,100 $ 119,100 82,000 537,000 738,100 310,000 (109,500) $ 938, 600 Assets Cash Accounts receivable Inventory Total current assets Equipment Accum. depreciation-Equipment Total assets Liabilities and Equity Accounts payable Income taxes payable Total current liabilities Equity Common stock, $2 par value Paid-in capital in excess of par value, common stock Retained earnings Total liabilities and equity $ $ 109,000 39,000 148,000 82,000 30, 600 112,600 605,200 215,800 124,100 $1,093, 100 579,000 176,500 70,500 $ 938,600 GOLDEN CORPORATION Income Statement For Current Year Ended December 31 Sales $1,847,000 Cost of goods sold 1,097,000 Gross profit 750,000 Operating expenses Depreciation expense $ 54,000 Other expenses 505,000 559,000 Income before taxes 191,000 Income taxes expense 37,400 Net income $ 153,600 Additional Information on Current Year Transactions a. Purchased equipment for $54,600 cash. b. Issued 13,100 shares of common stock for $5 cash per share. c. Declared and paid $100,000 in cash dividends. GOLDEN CORPORATION Spreadsheet for Statement of Cash Flows For Current Year Ended December 31 Analysis of Changes December 31, Prior Debit Credit Year December 31, Current Year $ $ 175,000 Balance sheet-debit balance accounts Cash Accounts receivable Inventory Equipment 119,100 82,000 537,000 310,000 1,048,100 $ $ 175,000 Balance sheet-credit balance accounts Accumulated depreciation Equipment Accounts payable Income taxes payable Common stock, $2 par value Paid-in capital in excess of par value, common stock Retained earnings 109,500 82,000 30,600 579,000 176,500 70,500 1,048, 100 $ $ 0 Statement of cash flows Operating activities Investing activities Financing activities $ 0 $ 0


