

Question
Golden State Bakers, Inc. (GSB) has an opportunity to invest in a new bread-making machine. GSB needs more productive capacity, so the new machine will
Golden State Bakers, Inc. (GSB) has an opportunity to invest in a new bread-making machine. GSB needs more productive capacity, so the new machine will not replace an existing machine. The new machine is priced at $260,000 and will require modifications costing $15,000. It has an expected useful life of 10 years, will be depreciated using the MACRS method over its 5-year class life, and has an expected salvage value of $12,500 at the end of Year 10. (See Table 10A.2 in Appendix 10A for MACRS recovery allowance percentages.) The machine will require a $22,500 investment in net working capital. It is expected to generate additional sales revenues of $125,000 per year, but its use also will increase annual cash operating expenses (excluding depreciation) by $55,000. GSBs required rate of return is 10 percent, and its marginal tax rate is 40 percent. The machines book value at the end of Year 10 will be $0, so GSB will have to pay taxes on the $12,500 salvage value.
- What is the NPV of this expansion project? Should GSB purchase the new machine?
- Suppose GSBs required rate of return is 12 percent rather than 10 percent. Also, assume the operating expenses increase by $65,000 rather than $55,000. Should the new machine be purchased in this case?
- Should GSB purchase the new machine if it is expected to be used for only five years and then sold for $31,250? Assume the conditions are the same as originally presented. (Note that the model is set up to handle a five-year life; you need to enter only the new life and salvage value.)
- Would the machine be profitable if revenues increased by only $105,000 per year? Assume everything else is as originally presented in part (a).
- Suppose revenues rose by $125,000 but expenses rose by $65,000. Would the machine be acceptable under these conditions? Assume a 10-year project life and a salvage value of $12,500.
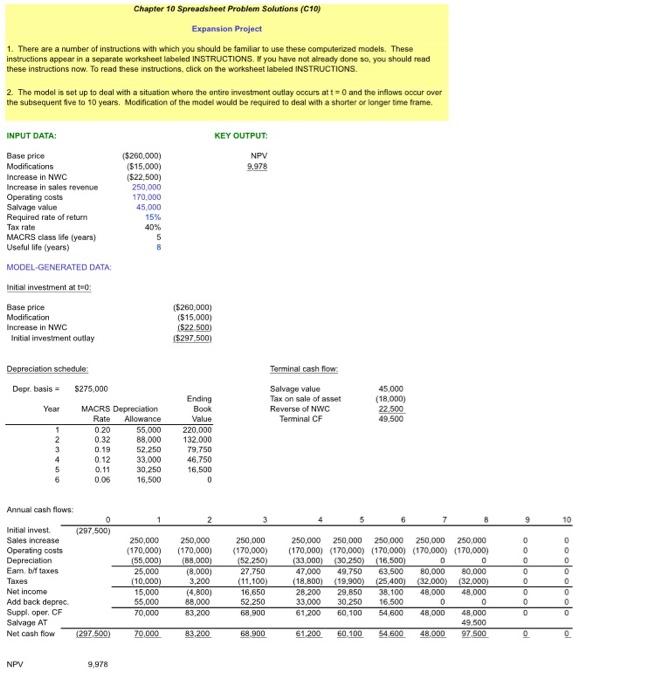
1. There are a number of instructions with which you should be familiar to use these computerized models. These instructions appear in a separate worksheet labeled INSTRUCTIONS. If you have not already done so, you should read these instructions now. To read these instructions, click on the worksheet labeled INSTRUCTIONS. 2. The model is set up to deal with a situation where the entire investment outlay occurs at t = 0 and the inflows occur over the subsequent five to 10 years. Modification of the model would be required to deal with a shorter or longer time frame. INPUT DATA: KEY OUTPUT: Base price ($260,000) NPV Modifications ($15,000) 9,978 Increase in NWC ($22,500) Increase in sales revenue 250,000 Operating costs 170,000 Salvage value 45,000 Required rate of return 15% Tax rate 40% MACRS class life (years) 5 Useful life (years) 8 MODEL-GENERATED DATA: Initial investment at t=0: Base price ($260,000) Modification ($15,000) Increase in NWC ($22,500) Initial investment outlay ($297,500) Depreciation schedule: Terminal cash flow: Depr. basis = $275,000 Salvage value 45,000 Ending Tax on sale of asset (18,000) Year MACRS Depreciation Book Reverse of NWC 22,500 Rate Allowance Value Terminal CF 49,500 1 0.20 55,000 220,000 2 0.32 88,000 132,000 3 0.19 52,250 79,750 4 0.12 33,000 46,750 5 0.11 30,250 16,500 6 0.06 16,500 0 Annual cash flows: 0 1 2 3 4 5 6 7 8 9 10 Initial invest. (297,500) Sales increase 250,000 250,000 250,000 250,000 250,000 250,000 250,000 250,000 0 0 Operating costs (170,000) (170,000) (170,000) (170,000) (170,000) (170,000) (170,000) (170,000) 0 0 Depreciation (55,000) (88,000) (52,250) (33,000) (30,250) (16,500) 0 0 0 0 Earn. b/f taxes 25,000 (8,000) 27,750 47,000 49,750 63,500 80,000 80,000 0 0 Taxes (10,000) 3,200 (11,100) (18,800) (19,900) (25,400) (32,000) (32,000) 0 0 Net income 15,000 (4,800) 16,650 28,200 29,850 38,100 48,000 48,000 0 0 Add back deprec. 55,000 88,000 52,250 33,000 30,250 16,500 0 0 0 0 Suppl. oper. CF 70,000 83,200 68,900 61,200 60,100 54,600 48,000 48,000 0 0 Salvage AT 49,500 Net cash flow (297,500) 70,000 83,200 68,900 61,200 60,100 54,600 48,000 97,500 0 0 NPV 9,978
Chapter 10 Spreadsheet Problem Solutions (C10) Expansion Project 1. There are a number of instructions with which you should be familiar to use these computerized models. These instructions appear in a separate worksheet labeled INSTRUCTIONS. If you have not already done so, you should read these instructions now. To read these instructions, click on the worksheet labeled INSTRUCTIONS. 2. The model is set up to deal with a situation where the entire investment outlay occurs at t=0 and the inflows occur over the subsequent five to 10 years. Modification of the model would be required to deal with a shorter or longer time frame. INPUT DATA: KEY OUTPUT: Base price NPV ($260,000) ($15,000) Modifications Increase in NWC ($22,500) Increase in sales revenue 250,000 Operating costs 170,000 Salvage value 45,000 Required rate of return 15% Tax rate 40% MACRS class life (years) 5 Useful life (years) B MODEL-GENERATED DATA: Initial investment at t=0: Base price Modification Increase in NWC Initial investment outlay Depreciation schedule Depr. basis Year 1 ($260,000) ($15,000) ($22.500) ($297,500) $275,000 Ending MACRS Depreciation Book Rate Allowance Value 0.20 55,000 220.000 0.32 88,000 132.000 0.19 52,250 79,750 0.12 33.000 46,750 0.11 30,250 16,500 0.06 16,500 0 2 3 250,000 250,000 250,000 (170,000) (170,000) (170,000) (55,000) (88,000) (52.250) 25,000 (8,000) 27,750 (10,000) 3,200 (11,100) 15,000 (4,800) 16,650 55,000 88,000 52.250 70,000 83,200 68.900 70,000 83,200 68,900 2 3 4 5 6 Annual cash flows: Initial invest Sales increase Operating costs Depreciation Eam bf taxes Taxes Net income Add back deprec Suppl. oper. CF Salvage AT Net cash flow NPV 0 (297,500) 9.978 (297,500) 9,978 Terminal cash flow Salvage value 45,000 Tax on sale of asset (18,000) Reverse of NWC Terminal CF 22.500 49.500 8 250,000 250,000 250,000 250,000 250,000 (170,000) (170,000) (170,000) (170,000) (170,000) (33.000) (30.250) (16.500) 0 0 47,000 49,750 63.500 80,000 80,000 (18.800) (19,900) (25,400) (32,000) (32,000) 28,200 29,850 38.100 48,000 48,000 33,000 30.250 16.500 0 60,100 54.600 48,000 0 61,200 48,000 49.500 97,500 61,200 60.100 54.600 48.000 9 0 oooooooo olo olo olo 0 0 0 0 0 10 0 0 oc 0 0 lol 0 Chapter 10 Spreadsheet Problem Solutions (C10) Expansion Project 1. There are a number of instructions with which you should be familiar to use these computerized models. These instructions appear in a separate worksheet labeled INSTRUCTIONS. If you have not already done so, you should read these instructions now. To read these instructions, click on the worksheet labeled INSTRUCTIONS. 2. The model is set up to deal with a situation where the entire investment outlay occurs at t=0 and the inflows occur over the subsequent five to 10 years. Modification of the model would be required to deal with a shorter or longer time frame. INPUT DATA: KEY OUTPUT: Base price NPV ($260,000) ($15,000) Modifications Increase in NWC ($22,500) Increase in sales revenue 250,000 Operating costs 170,000 Salvage value 45,000 Required rate of return 15% Tax rate 40% MACRS class life (years) 5 Useful life (years) B MODEL-GENERATED DATA: Initial investment at t=0: Base price Modification Increase in NWC Initial investment outlay Depreciation schedule Depr. basis Year 1 ($260,000) ($15,000) ($22.500) ($297,500) $275,000 Ending MACRS Depreciation Book Rate Allowance Value 0.20 55,000 220.000 0.32 88,000 132.000 0.19 52,250 79,750 0.12 33.000 46,750 0.11 30,250 16,500 0.06 16,500 0 2 3 250,000 250,000 250,000 (170,000) (170,000) (170,000) (55,000) (88,000) (52.250) 25,000 (8,000) 27,750 (10,000) 3,200 (11,100) 15,000 (4,800) 16,650 55,000 88,000 52.250 70,000 83,200 68.900 70,000 83,200 68,900 2 3 4 5 6 Annual cash flows: Initial invest Sales increase Operating costs Depreciation Eam bf taxes Taxes Net income Add back deprec Suppl. oper. CF Salvage AT Net cash flow NPV 0 (297,500) 9.978 (297,500) 9,978 Terminal cash flow Salvage value 45,000 Tax on sale of asset (18,000) Reverse of NWC Terminal CF 22.500 49.500 8 250,000 250,000 250,000 250,000 250,000 (170,000) (170,000) (170,000) (170,000) (170,000) (33.000) (30.250) (16.500) 0 0 47,000 49,750 63.500 80,000 80,000 (18.800) (19,900) (25,400) (32,000) (32,000) 28,200 29,850 38.100 48,000 48,000 33,000 30.250 16.500 0 60,100 54.600 48,000 0 61,200 48,000 49.500 97,500 61,200 60.100 54.600 48.000 9 0 oooooooo olo olo olo 0 0 0 0 0 10 0 0 oc 0 0 lol 0Step by Step Solution
There are 3 Steps involved in it
Step: 1

Get Instant Access to Expert-Tailored Solutions
See step-by-step solutions with expert insights and AI powered tools for academic success
Step: 2

Step: 3
Ace Your Homework with AI
Get the answers you need in no time with our AI-driven, step-by-step assistance
Get Started
A Guide To Starting Your Hedge Fund
Authors: John Thompson, Erik Serrano Berntsen
1st Edition
0470519401, 978-0470519400