Answered step by step
Verified Expert Solution
Question
1 Approved Answer
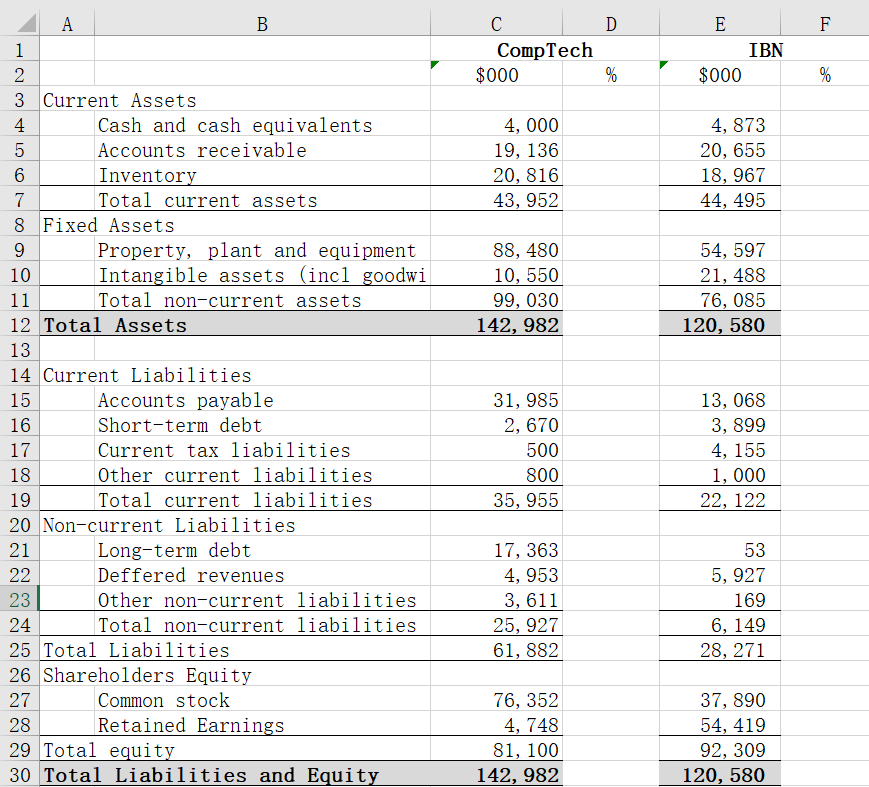
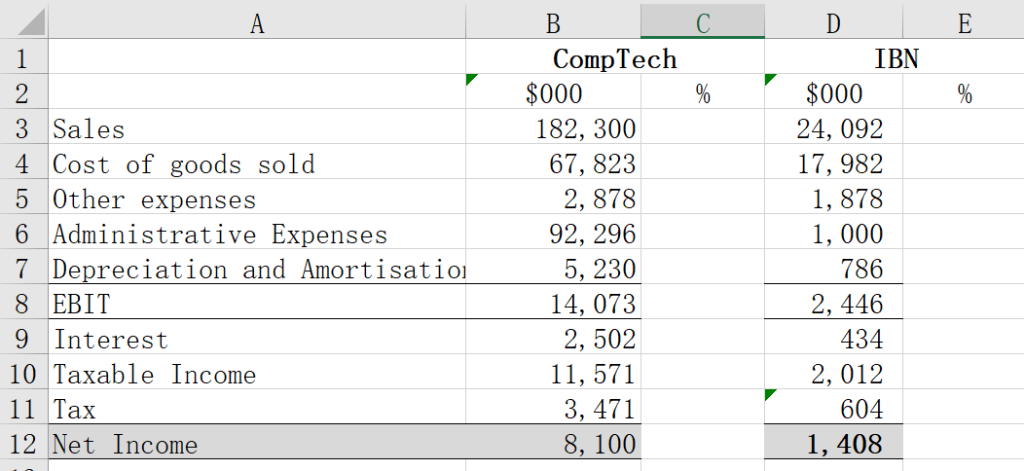
Google Excel: https://docs.google.com/spreadsheets/d/17UXg_XHPtx2tU6a32IygCnr9n17cHPSRIYIvmFcN48I/edit?usp=sharing CompTech IBN Liquidity Measures 1 Current Ratio 2 Quick Ratio 3 Cash Ratio Long-Term Solvency Measures 4 Total Debt Ratio 5 Times
Google Excel: https://docs.google.com/spreadsheets/d/17UXg_XHPtx2tU6a32IygCnr9n17cHPSRIYIvmFcN48I/edit?usp=sharing
| CompTech | IBN | ||
| Liquidity Measures | |||
| 1 | Current Ratio | ||
| 2 | Quick Ratio | ||
| 3 | Cash Ratio | ||
| Long-Term Solvency Measures | |||
| 4 | Total Debt Ratio | ||
| 5 | Times Interest Earned Ratio | ||
| 6 | Cash Coverage Ratio | ||
| Cash and Asset Management Measures | |||
| 7 | Inventory Turnover | ||
| 8 | Inventory Period (days) | ||
| 9 | Receivables Turnover | ||
| 10 | Receivables Period (days) | ||
| 11 | Payables Turnover | ||
| 12 | Payables Period (days) | ||
| 13 | Cash Cycle (days) | ||
| Market Value Measures | |||
| 14 | Price Earnings Ratio | ||
| 15 | Market to Book ratio | ||
| 16 | Enterprise Value ($000) | ||
| 17 | EBITDA ratio | ||
| DuPont Analysis | |||
| 18 | Return on Equity | ||
| 19 | Return on Assets | ||
| 20 | Profit Margin | ||
| 21 | Total Asset Turnover | ||
| 22 | Equity Multiplier | ||
| 23 | Debt Equity Ratio | ||
| Internal and Sustainable Growth | |||
| 24 | Dividend Payout Ratio | ||
| 25 | Retention Ratio | ||
| 26 | Internal Growth Rate | ||
| 27 | Sustainable Growth Rate | ||


Step by Step Solution
There are 3 Steps involved in it
Step: 1

Get Instant Access to Expert-Tailored Solutions
See step-by-step solutions with expert insights and AI powered tools for academic success
Step: 2

Step: 3

Ace Your Homework with AI
Get the answers you need in no time with our AI-driven, step-by-step assistance
Get Started


