

Answered step by step
Verified Expert Solution
Question
1 Approved Answer
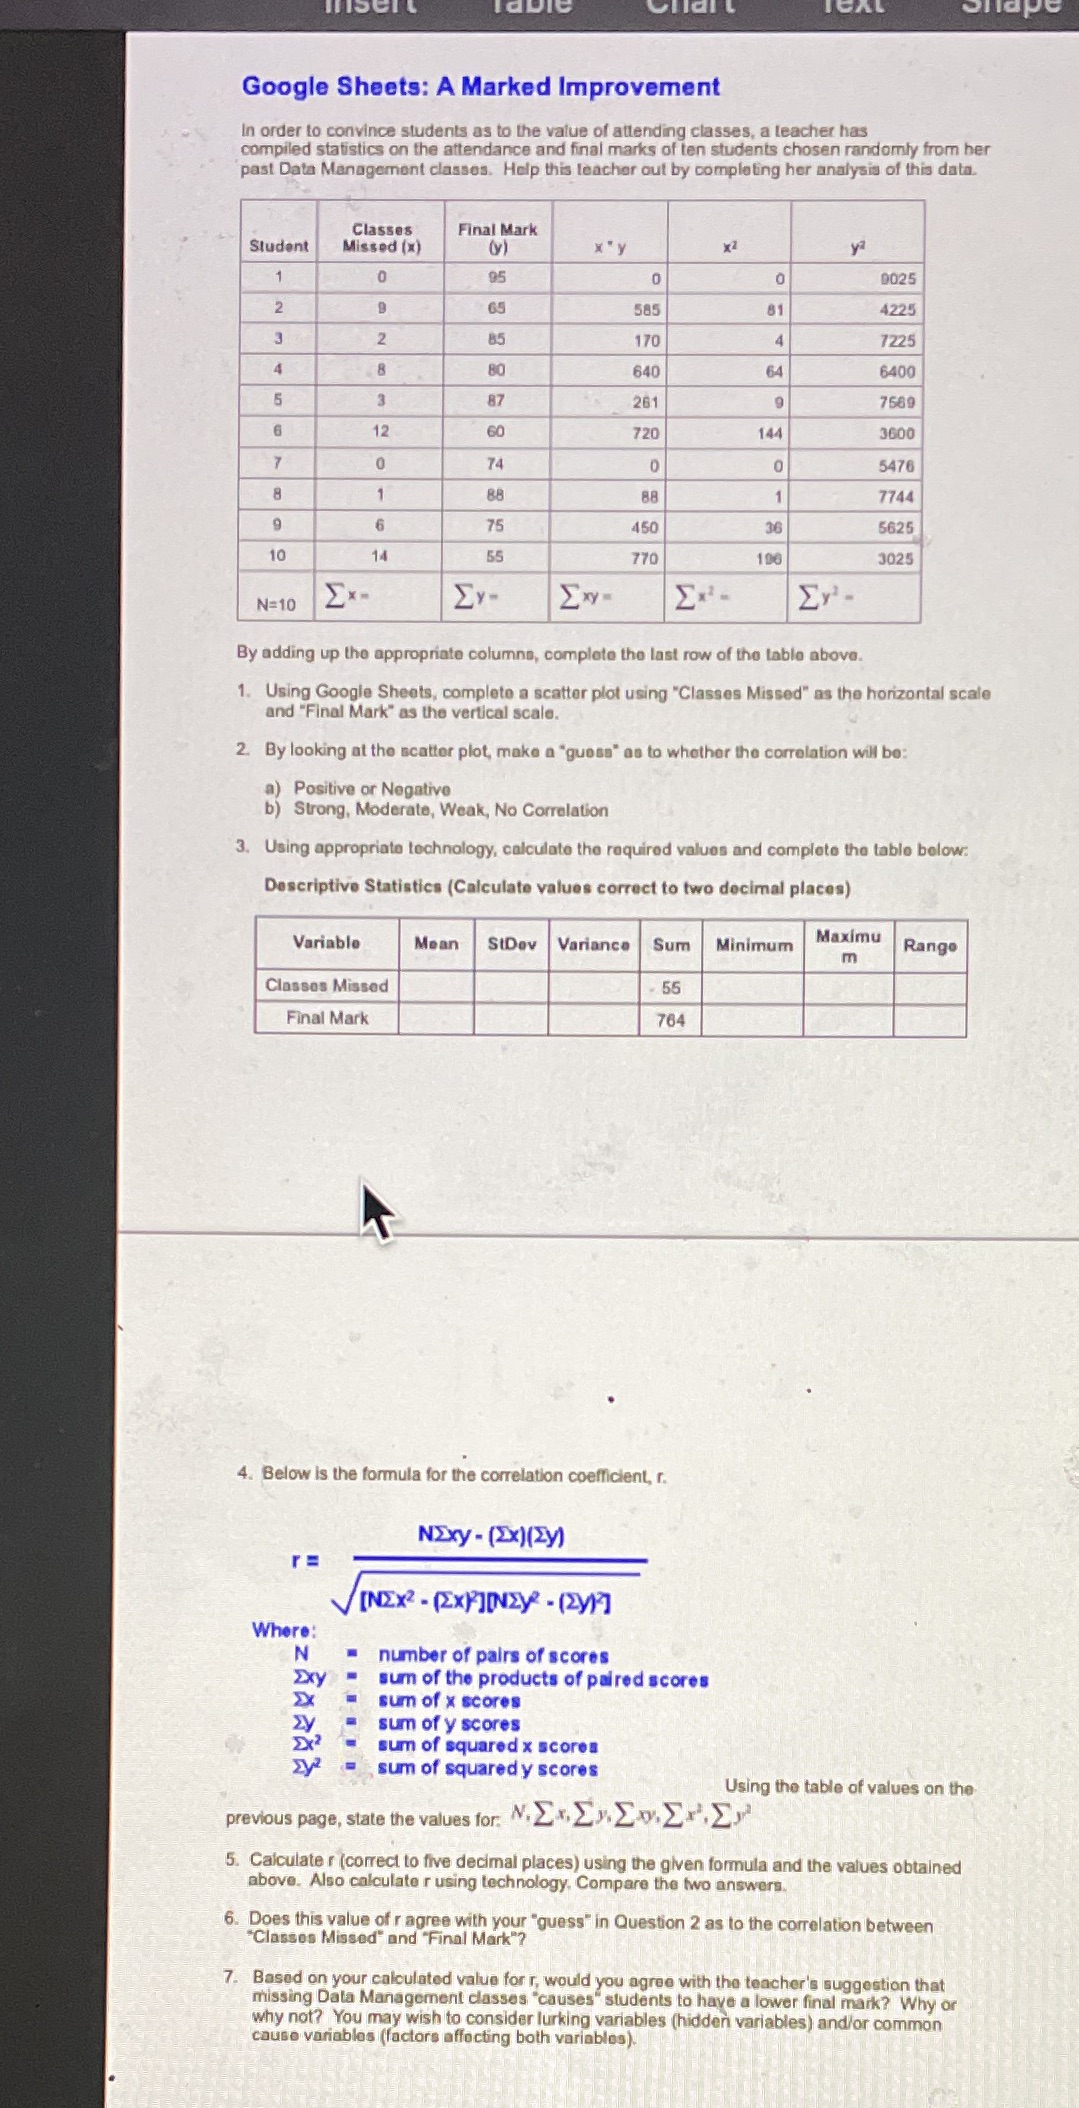
Google Sheets: A Marked Improvement In order to convince students as to the value of attending classes, a teacher has compiled statistics on the attendance
Step by Step Solution
There are 3 Steps involved in it
Step: 1

Get Instant Access to Expert-Tailored Solutions
See step-by-step solutions with expert insights and AI powered tools for academic success
Step: 2

Step: 3
Ace Your Homework with AI
Get the answers you need in no time with our AI-driven, step-by-step assistance
Get Started
Square Summable Power Series
Authors: Louis De Branges, James Rovnyak
1st Edition
0486801365, 9780486801360