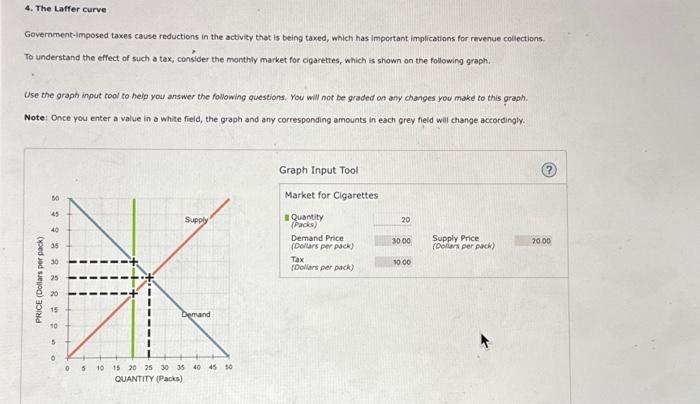
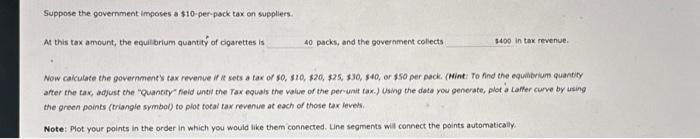
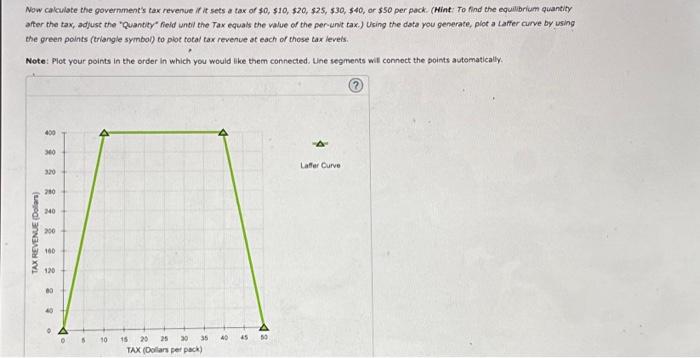
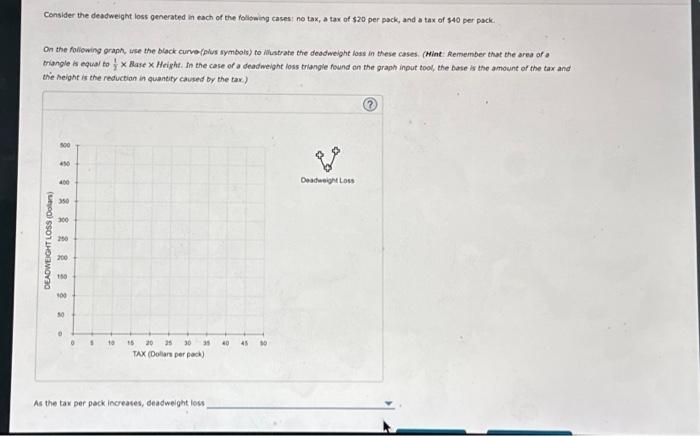
Government-Imposed taxes cause reductions in the activity that is being taxed, which has important implications for revenue collections. To understand the effect of such a tax, consider the monthly market for cigarettes, which is shown on the following graph. Use the graph input tool to help you answer the following questions. You wil not be graded on any changes you make to this graph. Note: Once you enter a value in o white field, the graph and any corresponding amounts in each grey field will change accordingly. Suppose the government imposes a $10-per-pack tax on suppliers. At this tax amount, the equitiorium quantity of cigarettes is packs, and the government coliects n tax revenue. Now calculate the government's tax revenue if it sets a tax of $0,$10,$20,$25,$30,$40, or $50 per pack. (Mint: Fo find the equibrium quantity after the tax, adjust the "Quantify' field untit the Tax equals the value of the per-unit tax.) (Ssing the data vou generate, plot a taffer curve by using the green points (triangle symbol) to plot fotal tax revenue at each of those tar levels. Note: Plot your points in the order in which you would tike them connected. Une segments will connect the points automatically. Now cakculate the government's tax revenue if it sets a tax of $0,$10,$20,$25,$30,$40, or $50 per pack. (Hint: To find the equilibrium quantity after the tax, adjust the 'Quantiby" field unbl the Tax equals the value of the per-unit tax.) Using the data you generate, plot a Laffer cume by using the green points (triangle symbol) to piot total tax revenue at each of those tax levels. Note: Plot your points in the order in which you would ilke them connected. Une segments wil connoct the points automatically. Suppose the government is currently imposing a $10-per-pack tax on clgarettes. True or False: The government can raise its, tax revenue by increasing the per-unit tax on cigarettes. True False Censider the deadweight loss generated in each of the following cases: no tax, a tax of $20 per pack, and a tax of $40 per pack. On the following graph, wse the black curvo(plis symbols) to illatrate the deadwelght loss in these cases. (Mint: Atemember that the area of a triangle is equar to y1 Base Height. fin the case of a deadweight loss triangle found an the graph input tool, the Base is the amount of the tax and the height is the reduction in quantity caused by the tax) As the tax per pack increases, deadweight loss Government-Imposed taxes cause reductions in the activity that is being taxed, which has important implications for revenue collections. To understand the effect of such a tax, consider the monthly market for cigarettes, which is shown on the following graph. Use the graph input tool to help you answer the following questions. You wil not be graded on any changes you make to this graph. Note: Once you enter a value in o white field, the graph and any corresponding amounts in each grey field will change accordingly. Suppose the government imposes a $10-per-pack tax on suppliers. At this tax amount, the equitiorium quantity of cigarettes is packs, and the government coliects n tax revenue. Now calculate the government's tax revenue if it sets a tax of $0,$10,$20,$25,$30,$40, or $50 per pack. (Mint: Fo find the equibrium quantity after the tax, adjust the "Quantify' field untit the Tax equals the value of the per-unit tax.) (Ssing the data vou generate, plot a taffer curve by using the green points (triangle symbol) to plot fotal tax revenue at each of those tar levels. Note: Plot your points in the order in which you would tike them connected. Une segments will connect the points automatically. Now cakculate the government's tax revenue if it sets a tax of $0,$10,$20,$25,$30,$40, or $50 per pack. (Hint: To find the equilibrium quantity after the tax, adjust the 'Quantiby" field unbl the Tax equals the value of the per-unit tax.) Using the data you generate, plot a Laffer cume by using the green points (triangle symbol) to piot total tax revenue at each of those tax levels. Note: Plot your points in the order in which you would ilke them connected. Une segments wil connoct the points automatically. Suppose the government is currently imposing a $10-per-pack tax on clgarettes. True or False: The government can raise its, tax revenue by increasing the per-unit tax on cigarettes. True False Censider the deadweight loss generated in each of the following cases: no tax, a tax of $20 per pack, and a tax of $40 per pack. On the following graph, wse the black curvo(plis symbols) to illatrate the deadwelght loss in these cases. (Mint: Atemember that the area of a triangle is equar to y1 Base Height. fin the case of a deadweight loss triangle found an the graph input tool, the Base is the amount of the tax and the height is the reduction in quantity caused by the tax) As the tax per pack increases, deadweight loss