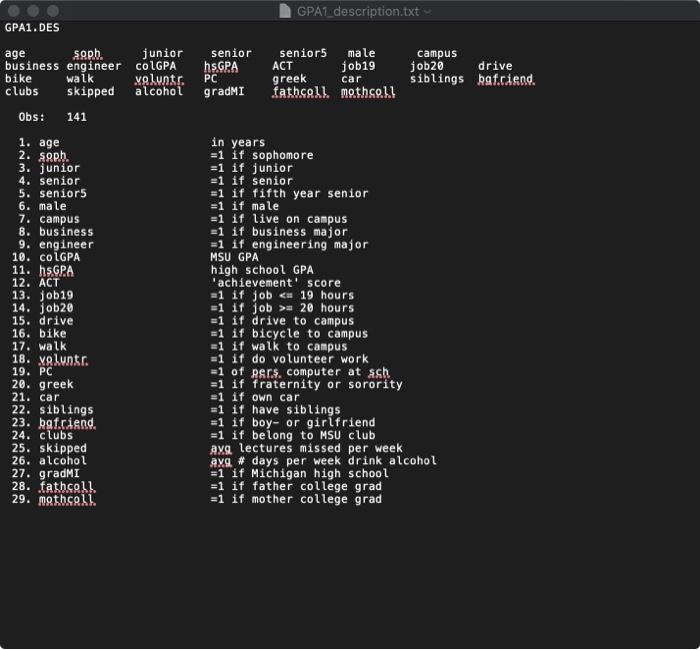
GPA1_description.txt age GPA1. DES saph. junior business engineer COLGPA bike walk voluntr. clubs skipped alcohol Obs: 141 senior hsGPA PC gradMI senior male ACT job19 greek fathcall mothcoll campus job20 drive siblings baf.ciend. car 1. age 2. Soph. 3. junior 4. senior 5. senior5 6. male 7. campus 8. business 9. engineer 10. COLGPA 11. hs.GPA 12. ACT 13. job19 14. job20 15. drive 16. bike 17. walk 18. voluntr. 19. PC 20. greek 21. car 22. siblings 23. bgt.riend 24. clubs 25. skipped 26. alcohol 27. gradMI 28. tatbal! 29. mathcoll. in years =1 if sophomore =1 if junior =1 if senior =1 if fifth year senior =1 if male =1 if live on campus =1 if business major =1 if engineering major MSU GPA high school GPA achievement' score =1 if job = 20 hours =1 if drive to campus =1 if bicycle to campus =1 if walk to campus =1 if do volunteer work =1 of pers, computer at sch =1 if fraternity or sorority =1 if own car =1 it have siblings =1 if boy- or girlfriend =1 if belong to MSU club ava lectures missed per week aya days per week drink alcohol =1 if Michigan high school =1 if father college grad =1 if mother college grad Question 5: Simple linear regression (a) Produce a scatter plot of college GPA (on the vertical axis) and average lectures missed per week (skipped, on the horizontal axis). (2 marks) (b) Based on your diagram in (a), what can you tell about the casual relationship between the two variables? (3 marks) (e) Set up the econometric model (population regression function with random specification), with each observation indexed by i, to represent this causal relationship in the population, assuming a linear relationship between the two variables, with B being the intercept parameter and B, being the slope parameter, indicating clearly the a priori expectations of the signs of the parameters, and the assumptions on the random error terms. (5 marks) (d) Specify the sample regression function with random specification, with each observation indexed by i, to represent the model that you will fit to the sample of data. (2 marks) (e) Estimate the sample regression function in (d), and report the fitted regression line to the data, showing the estimated parameters, standard errors of the parameter estimates, sample size and R-squared. (5 marks) (1) Interpret the parameter estimates and R-squared. (6 marks) (g) Predict the college GPA if the number of missed lectures per week is 2. (3 marks) (h) Suppose a student has missed 2 lectures per week and a college GPA of 2.9. What is the amount of over prediction or under prediction of her GPA, that is, the residual amount for this student according to the fitted regression line? Draw a diagram to illustrate this situation, with the fitted regression line, sample observation point of the student, the predicted value of the student's GPA, and the corresponding residual. (3, 5 marks)