

Answered step by step
Verified Expert Solution
Question
1 Approved Answer
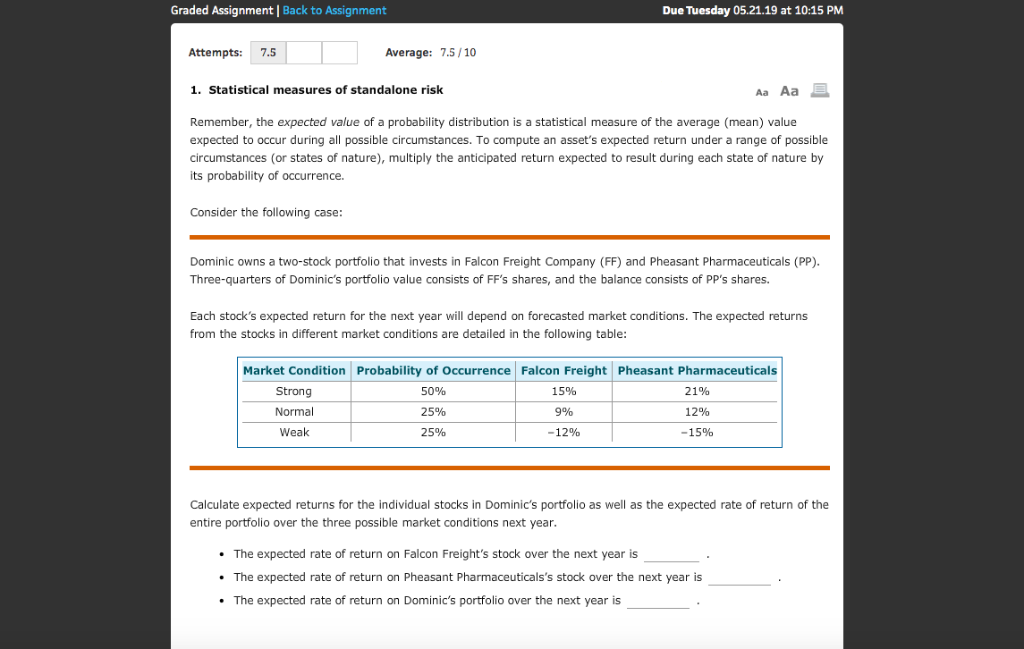
Graded Assignment Back to Assignment Due Tuesday 05.21.19 at 10:15 PM Attempts: 7.5 Average: 7.5/10 1. Statistical measures of standalone risk Aa Aa Remember, the
Step by Step Solution
There are 3 Steps involved in it
Step: 1

Get Instant Access to Expert-Tailored Solutions
See step-by-step solutions with expert insights and AI powered tools for academic success
Step: 2

Step: 3
Ace Your Homework with AI
Get the answers you need in no time with our AI-driven, step-by-step assistance
Get Started
Cryptoassets The Innovative Investors Guide To Bitcoin And Beyond
Authors: Chris Burniske ,Jack Tatar
1st Edition
1260026671, 126002668X, 9781260026672, 9781260026689