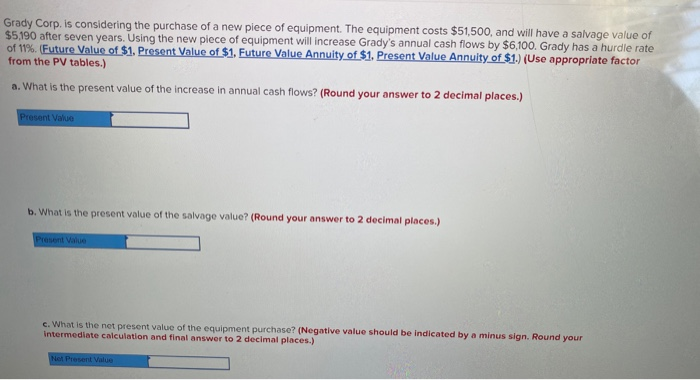
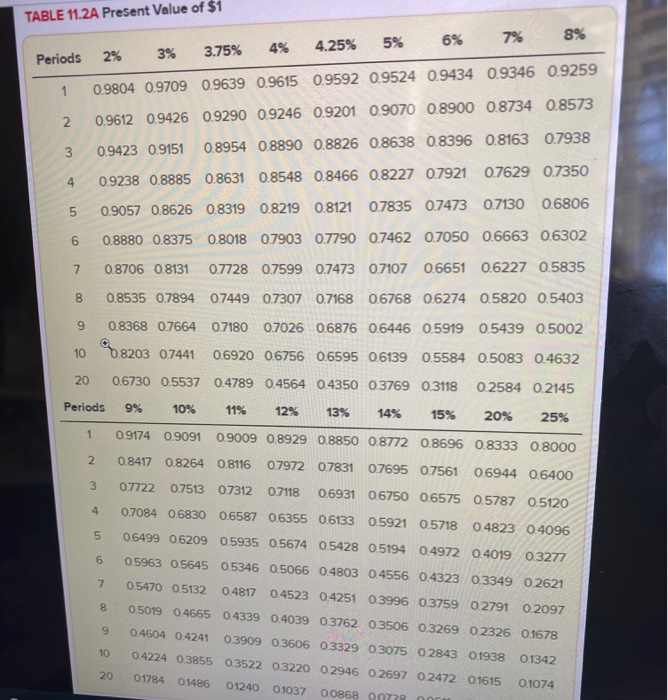
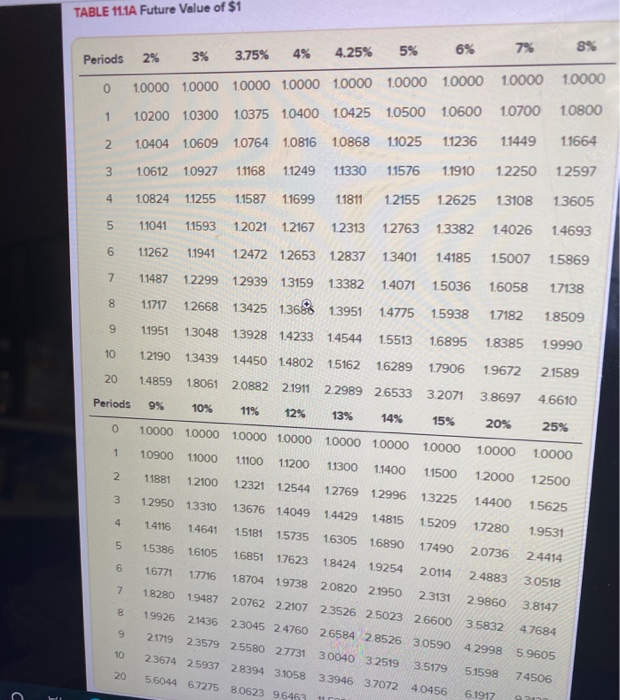
Grady Corp. is considering the purchase of a new piece of equipment. The equipment costs $51,500, and will have a salvage value of $5,190 after seven years. Using the new piece of equipment will increase Grady's annual cash flows by $6,100. Grady has a hurdle rate of 1%. (Future Value of $1. Present Value of $1. Future Value Annuity of $1. Present Value Annuity of $1.) (Use appropriate factor from the PV tables.) a. What is the present value of the increase in annual cash flows? (Round your answer to 2 decimal places.) Present Value b. What is the present value of the salvage value? (Round your answer to 2 decimal places.) Present Value c. What is the net present value of the equipment purchase? (Negative value should be indicated by a minus sign. Round your intermediate calculation and final answer to 2 decimal places.) Net Present Value TABLE 11.2A Present Value of $1 6% 7% 8% 5% 4.25% 2% 3.75% 4% Periods 3% 1 0.9804 0.9709 0.9639 0.9615 0.9592 0.9524 0.9434 0.9346 0.9259 2 0.9612 0.9426 0.9290 0.9246 0.9201 0.9070 0.8900 0.8734 0.8573 3 0.9423 0.9151 0.8954 0.8890 0.8826 0.8638 0.8396 0.8163 0.7938 4 0.9238 0.8885 0.8631 0.8548 0.8466 0.8227 0.7921 0.7629 07350 5 0.9057 0.8626 0.8319 0.8219 0.8121 0.7835 0.7473 0.7130 0.6806 6 0.8880 0.8375 0.8018 0.7903 0.7790 0.7462 0.7050 0.6663 0.6302 7 0.8706 0.8131 0.7728 0.7599 0.7473 0.7107 0.6651 0.6227 0.5835 8 0.8535 0.7894 0.7449 07307 0.7168 0.6768 0.6274 0.5820 0.5403 9 0.8368 0.7664 0.7180 0.7026 0.6876 0.6446 0.5919 0.5439 0.5002 10 08203 0.7441 0.6920 0.6756 0.6595 0.6139 0.5584 0.5083 0.4632 20 0.6730 0.5537 0.4789 0.4564 0.4350 0.3769 0.3118 0.2584 0.2145 Periods 9% 10% 11% 12% 13% 14% 15% 20% 25% 1 0.9174 0.9091 0.9009 0.8929 0.8850 0.8772 0.8696 0.8333 0.8000 2 0.8417 0.8264 0.8116 0.7972 0.7831 0.7695 0.7561 0.6944 0.6400 3 0.7722 0.7513 0.7312 0.7118 0.6931 06750 0.6575 0.5787 0.5120 4 0.7084 0.6830 0.6587 0.6355 0.6133 0.5921 0.5718 0.4823 0.4096 5 0.6499 0.6209 0.5935 0.5674 0.5428 0.5194 0.4972 0.4019 0.3277 6 0.5963 0.5645 0.5346 0.5066 0.4803 0.4556 0.4323 0.3349 02621 7 0.5470 0.5132 0.4817 0.4523 0.4251 0.3996 0.3759 0.2791 0.2097 8 0.5019 0.4665 0.4339 0.4039 0.3762 0.3506 0.3269 0.2326 0.1678 9 0.4604 0.4241 0.3909 0.3606 0.3329 0.3075 0.2843 0.1938 10 04224 0.3855 0.3522 0.3220 0 2946 02697 0 2472 0.1615 0.1342 20 0.1784 0 1486 01240 0.1074 01037 00868 00728 TABLE 11.1A Future Value of $1 7% Periods 3% 5% 8% 2% 3.75% 4.25% 6% 4% 1.0000 1.0000 10000 1.0000 1.0000 10000 10000 10000 10000 0 1.0200 1.0300 1.0375 10400 1.0425 1.0500 1.0600 10700 1 10800 2 10404 10609 1.0764 1.0816 10868 11025 11236 1.1449 11664 3 1.0612 10927 11168 1.1249 11330 1.1576 1.1910 12250 12597 4 1.0824 1.1255 1.1587 11699 1.1811 1.2155 1.2625 1.3108 1.3605 5 1.1041 1.1593 1.2021 1.2167 12313 1.2763 1.3382 1.4026 1.4693 6 11262 1.1941 12472 12653 12837 13401 14185 1.5007 1.5869 7 1.1487 1.2299 1.4071 1.5036 1.6058 17138 12939 13159 1.3382 13425 136 13951 8 1.1717 12668 1.4775 1.5938 1.7182 18509 9 11951 13048 13928 1.4233 1.4544 1.5513 1.6895 1.8385 1.9990 10 12190 13439 1.4450 14802 15162 1.6289 1.7906 1.9672 2.1589 20 14859 18061 2.0882 2.1911 2.2989 26533 32071 3.8697 Periods 4.6610 9% 10% 11% 12% 13% 14% 15% 0 20% 10000 10000 10000 10000 10000 10000 25% 1 1.0000 10900 11000 10000 10000 11100 1.1200 11300 1.1400 2 11500 11881 12100 12000 12321 12500 12544 12769 3 12996 12950 13225 13310 14400 13676 1.4049 15625 1.4429 4 1.4815 14116 1.5209 14641 15181 17280 1.5735 1.9531 16305 16890 5 15386 16105 1.7490 16851 17623 2.0736 24414 18424 1.9254 6 16771 17716 20114 1.8704 1.9738 2.0820 2.1950 2.4883 3 0518 7 1.8280 19487 2.0762 22107 23526 25023 2.6600 2.3131 2.9860 3.8147 8 1.9926 2.1436 2.3045 2.4760 26584 28526 3.0590 42998 3.5832 9 4.7684 21719 2.3579 2.5580 27731 30040 3.2519 10 2.3674 2.5937 2 8394 3.1058 5.9605 3.5179 20 5.1598 5.6044 67275 80623 9.6463 3.3946 37072 74506 4,0456 11 6.1917 2