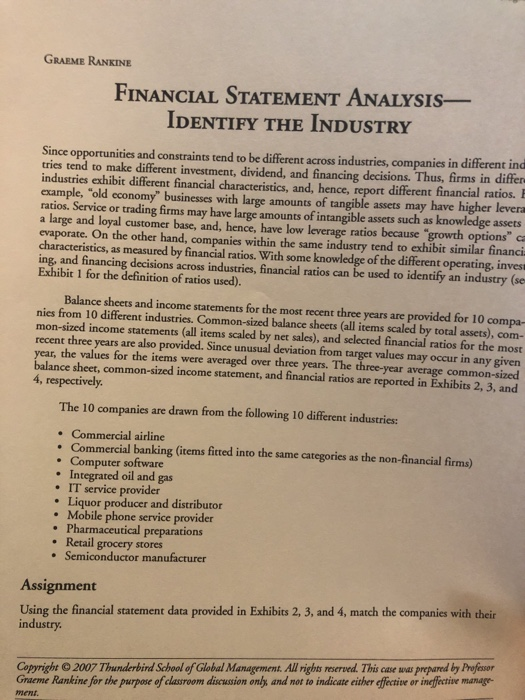
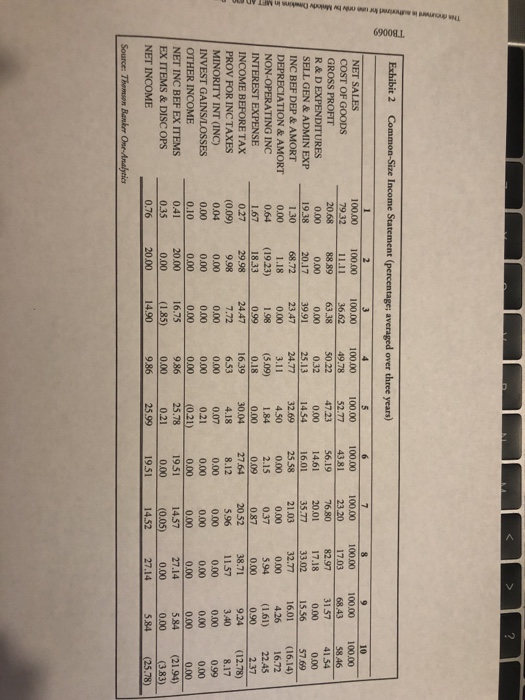
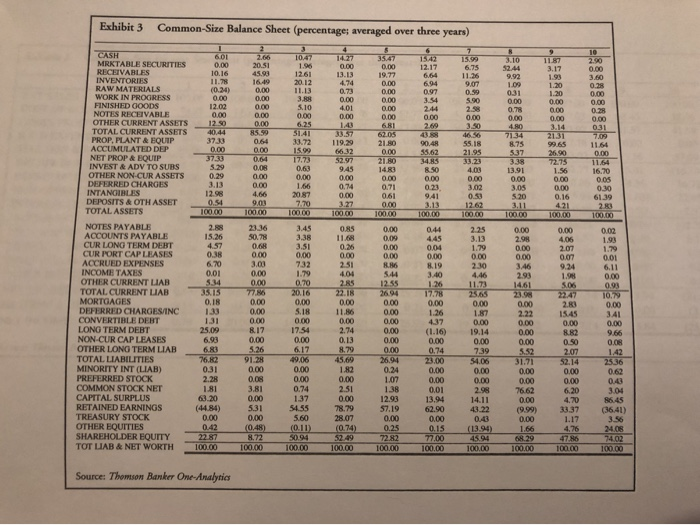
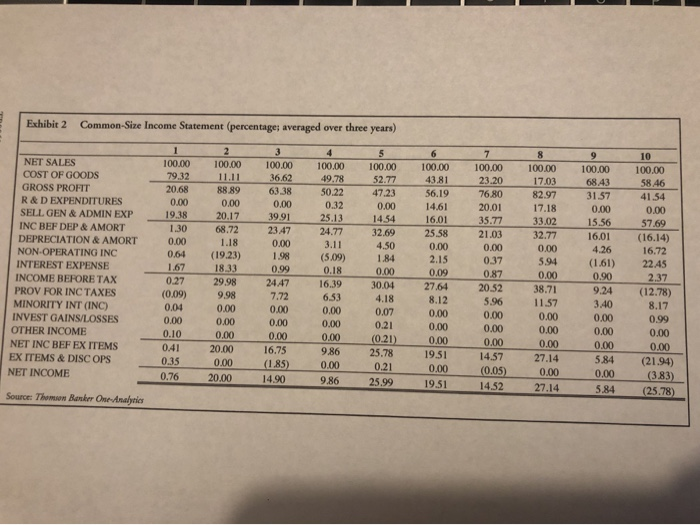
GRAEME RANKINE FINANCIAL STATEMENT ANALYSIS- IDENTIFY THE INDUSTRY Since opportunities and constraints tend to be different across industries, companies in different ind tries tend to make different investment, dividend, and financing decisions. Thus, firms in differe industries exhibit different financial characteristics, and, hence, report different financial ratios. E example, "old economy" businesses with large amounts of tangible ratios. Service or trading firms may have large amounts of intangible large and loyal customer base, and, hence, have low leverage ratios because "growth options" ca evaporate. On the other hand, companies within the same characteristics, as measured by financial ratios. With some knowledge of the different operating, invest ing, and financing decisions across industries, financial ratios can Exhibit 1 for the definition of ratios used). assets may have higher levera assets such as knowledge assets a industry tend to exhibit similar financia be used to identify an industry (se Balance sheets and income statements for the most recent three years are nies from 10 different industries. Common-sized balance sheets (all items scaled by total assets), com- mon-sized income statements (all items scaled by net sales), and selected financial ratios for the most recent three years are also provided. Since unusual deviation from target values may occur in any given year, the values for the items were averaged balance sheet, common-sized income statement, and financial ratios are 4, respectively. provided for 10 compa- over three years. The three-year average common-sized reported in Exhibits 2, 3, and The 10 companies are drawn from the following 10 different industries: Commercial airline Commercial banking (items fitted into the same Computer software Integrated oil and gas IT service provider Liquor producer and distributor Mobile phone service provider Pharmaceutical preparations Retail grocery stores Semiconductor manufacturer categories as the non-financial firms) Assignment Using the financial statement data provided in Exhibits 2, 3, and 4, match the companies with their industry. Copyright 2007 Thunderbird School of Global Management. All rights reserved. This case was prepared by Professor Graeme Rankine for the purpose of classroom discussion only and not to indicate either effective or incfective manage ment. 69008L ? Exhibit 2 Common-Size Income Statement (percentage; averaged over three years) 2 3 4 6 7 10 NET SALES COST OF GOODS 100.00 100.00 100.00 100.00 100.00 100.00 100.00 100.00 100,00 100.00 79.32 11.11 36.62 49.78 52.77 43.81 23.20 17.03 68.43 58.46 GROSS PROFIT R & D EXPENDITURES SELL GEN & ADMIN EXP 20.68 88.89 63.38 50.22 47.23 56.19 7680 82.97 31.57 41.54 0.00 0.00 20.17 0.00 0.32 0.00 14.61 20.01 17.18 0.00 0.00 19.38 39.91 25.13 14.54 16.01 35.77 33.02 15.56 57.69 INC BEF DEP & AMORT DEPRECIATION & AMORT 1.30 68.72 23.47 24.77 25.58 32.69 4.50 21.03 32.77 16.01 (16.14) 16.72 22.45 0.00 1.18 0.00 3.11 0.00 0.00 0.00 5.94 4.26 NON-OPERATING INC 0.64 (19.23) 18.33 198 (5.09) 184 2.15 0.37 (1.61) 0.90 INTEREST EXPENSE 1.67 0.99 0.18 0.00 0.09 087 0,00 2.37 INCOME BEFORE TAX 0.27 29.98 24.47 16.39 30.04 27.64 20.52 38.71 9.24 (12.78) 8.17 PROV FOR INC TAXES (0.09) 9.98 7.72 6.53 4.18 8.12 5.96 11.57 3.40 MINORITY INT (INC) 0.04 0.00 0.00 0.00 0.07 0.00 0.00 0.00 0.00 0.99 INVEST GAINS/LOSSES 0.00 0.00 0.00 0.00 0.21 0.00 0.00 0.00 0,00 0.00 0.10 0.00 0.00 0.00 0.00 (0.21) 25.78 OTHER INCOME 0.00 0.00 0.00 0.00 NET INC BEF EX ITEMS 0.41 20.00 16.75 9.86 19.51 14.57 27.14 584 (21.94) (383) EX ITEMS & DISC OPS 0.35 0.00 (1.85) 0.00 0.21 0,00 (0.05) 0.00 0.00 NET INCOME 0.76 20.00 14.90 9.86 25.99 19.51 14.52 27.14 584 (25.78) Source: Thomson Banker One-Analytics Exhibit 3 Common-Size Balance Sheet (percentage; averaged over three years) 2 2,66 20.51 7 15.99 6.75 11.26 9.07 0.59 10 CASH MRKTABLE SECURITIES: RECEIVABLES INVENTORIES RAW MATERIALS WORK IN PROGRESS FINISHED GOODS NOTES RECEIVABLE OTHER CURRENT ASSETS TOTAL CURRENT ASSETS PROP. PLANT&EQUIP ACCUMULATED DEP NET PROP & EQUIP INVEST &ADV TO SUBS OTHER NON-CUR ASSETS DEFERRED CHARGES INTANGIBLES DEPOSITS & OTH ASSET TOTAL ASSETS 10.47 1.96 12.61 20.12 11.13 3.88 5.10 0.00 6.25 51.41 33.72 15.99 17.73 0.63 0,00 35.47 14.27 1542 12.17 3.10 52.44 9.92 109 031 0.00 11.87 3.17 1.93 2.90 0.00 10.16 0.00 0.00 19.77 0.00 3.60 0.28 0.00 0,00 45.93 13.13 474 073 0.00 4.01 6.64 11.78 16.49 0,00 0.00 6.94 1.20 (0.24) 0,00 12.02 0,00 12.50 0.00 000 0.97 3.54 2.44 0.00 2.69 43.88 1.20 0,00 5.90 0.00 0.00 0.00 0.00 2.58 0.78 0,00 0.28 0.00 0,00 0.00 0,00 0,00 0.31 7,09 0,00 0.00 143 33.57 119.29 6632 5297 9.45 0.00 0.74 0.00 3.27 6.81 62.05 3.50 4656 480 3.14 2131 40.44 85.59 0.64 0,00 0,64 71.34 3733 21.80 000 21 H0 90.48 55.18 21.95 33.23 4.03 875 5.37 3.38 13.91 0.00 3.05 5.20 99.65 11.64 0.00 55.62 34.85 26.90 7275 0.00 11.64 37.33 529 0.29 3.13 12.98 0.54 100.00 0.08 0.00 0.00 4.66 9,03 100,00 1483 0.00 071 0.61 0,00 100.00 8.50 1.56 0.00 0.00 0.16 421 100.00 16.70 0.00 0.00 0.05 1,66 20.87 7.70 3.02 0.23 941 3.13 100,00 0.30 6139 2.83 100,00 0.53 12.62 100.00 3.11 100.00 100.00 100.00 NOTES PAYABLE ACCOUNTS PAYABLE CUR LONG TERM DEBT CUR PORT CAP LEASES ACCRUED EXPENSES INCOME TAXES OTHER CURRENT LIAB TOTAL CURRENT LIAB MORTGAGES 2.88 23.36 50.78 0,68 000 3.0 0.00 0,00 7786 3.45 3.38 3.51 0.00 732 1.79 0.70 20.16 0.00 5.18 085 11.68 0.26 0.00 2.51 0.00 0.09 044 445 004 0.00 2.25 0.00 2.98 0.00 0.00 3.46 2.93 0.00 002 193 1.79 001 15.26 4.57 0.38 3.13 4.06 2.07 0.07 9.24 000 0.00 8.86 1.79 0.00 2.30 6.70 0.01 534 35.15 8.19 3.40 6.11 0.00 0.93 10.79 0.00 3.41 0.00 4.04 2.85 22.18 544 12.55 26.94 000 4.46 11.73 25.65 0,00 1.98 5.06 22.47 2.83 126 17.78 000 1.26 14.61 23.98 0.00 0.18 0.00 0.00 DEFERRED CHARGESINC CONVERTIBLE DEBT LONG TERM DEBT NON-CUR CAP LEASES OTHER LONG TERM LIAB 133 0.00 11.86 0.00 2.74 0.13 8.79 45.69 182 0.00 0.00 0,00 0,00 0.00 1,87 0.00 19.14 0.00 2.22 0.00 0.00 1545 0,00 8.82 0.50 2.07 52.14 0.00 131 25.09 0.00 8.17 0.00 5.26 91.28 0.00 437 17.54 (1.16) 9.66 0.08 6.93 6.83 0.00 6.17 49.06 000 0.00 0.74 23.00 0.00 0,00 5.52 000 739 1.42 25.36 0.62 26.94 76.82 0.31 TOTAL LIABILIITIES MINORITY INT (LIAB) PREFERRED STOCK COMMON STOCK NET CAPITAL SURPLUS RETAINED EARNINGS TREASURY STOCK 31.71 0,00 54.06 0.00 0.24 107 138 0.00 0.00 2.98 2.28 0,08 0,00 0.74 137 0.00 0.01 13.94 0.00 0.00 0.43 1.81 3.81 0.00 2.51 76.62 6.20 3.04 63.20 0.00 78.79 12.93 57.19 0.00 14.11 000 4.70 8645 (44.84) 0.00 5.31 54.55 62.90 43.22 (9.99) 0,00 33.37 (36.41) 3.56 0,00 5.60 28.07 0.00 0.15 77.00 100.00 0.43 1.17 4,76 47.86 OTHER EQUITIES SHAREHOLDER EQUITY TOT LIAB & NET WORTH 0.42 (0.48) 72 (0.11) 50.94 (13.94) (074) 0,25 7282 100.00 1.66 68.29 24.08 74.02 100.00 22.87 45.94 100.00 100.00 100.00 100.00 100.00 100.00 100.00 Source: Thomson Banker One-Analytics Exhibit 2 Common-Size Income Statement (percentage; averaged over three years) 2 3 4 6 7 5 8 10 NET SALES COST OF GOODS GROSS PROFIT 100.00 79.32 100.00 100.00 100.00 100.00 100.00 100.00 100.00 100.00 100.00 11.11 36.62 49.78 52.77 43.81 23.20 17.03 68.43 58 46 20.68 88.89 63.38 50.22 47.23 56.19 76.80 82.97 31.57 41.54 R & D EXPENDITURES SELL GEN & ADMIN EXP 0.00 0,00 0,00 0.32 0,00 14.61 20.01 17.18 0,00 0,00 19.38 20.17 39.91 25.13 14.54 16.01 35.77 33.02 15.56 57,69 INC BEF DEP & AMORT 1.30 68.72 2347 24.77 32.69 25.58 21.03 32.77 16.01 (16.14) DEPRECIATION & AMORT 0.00 1.18 0,00 3.11 4.50 1.84 0.00 0.00 0,00 NON-OPERATING INC 4.26 16.72 0,64 (19.23) 1.98 (5.09) 2.15 0.37 5.94 (1,61) 0.90 INTEREST EXPENSE 22.45 1.67 18.33 0,99 0.18 0.00 0.09 0.87 0.00 2.37 INCOME BEFORE TAX 0.27 29.98 2447 16.39 30.04 27.64 20.52 38.71 11.57 9.24 PROV FOR INC TAXES (12.78) 8.17 (0.09) 9.98 7.72 6.53 4.18 8.12 5.96 MINORITY INT (INC) 3.40 0.04 0,00 0,00 0.00 0,07 0.00 0,00 0.00 INVEST GAINS/LOSSES OTHER INCOME NET INC BEF EX ITEMS 0,00 0.99 0,00 0.00 0.00 0.00 0.21 0.00 0.00 0.00 0.00 0.00 0.10 0.00 0.00 0.00 (0.21) 25.78 0,00 0.00 0.00 0.00 0.41 0.00 20.00 16.75 9.86 19.51 14.57 EX ITEMS& DISC OPS 27.14 5.84 0.35 (21.94) (383) 0,00 (1.85) 0.00 0.21 0,00 (0.05) NET INCOME 0,00 0,00 0.76 20.00 14.90 9.86 25.99 19.51 14,52 27.14 5,84 (25.78) Source: Themon Banker One Analyties GRAEME RANKINE FINANCIAL STATEMENT ANALYSIS- IDENTIFY THE INDUSTRY Since opportunities and constraints tend to be different across industries, companies in different ind tries tend to make different investment, dividend, and financing decisions. Thus, firms in differe industries exhibit different financial characteristics, and, hence, report different financial ratios. E example, "old economy" businesses with large amounts of tangible ratios. Service or trading firms may have large amounts of intangible large and loyal customer base, and, hence, have low leverage ratios because "growth options" ca evaporate. On the other hand, companies within the same characteristics, as measured by financial ratios. With some knowledge of the different operating, invest ing, and financing decisions across industries, financial ratios can Exhibit 1 for the definition of ratios used). assets may have higher levera assets such as knowledge assets a industry tend to exhibit similar financia be used to identify an industry (se Balance sheets and income statements for the most recent three years are nies from 10 different industries. Common-sized balance sheets (all items scaled by total assets), com- mon-sized income statements (all items scaled by net sales), and selected financial ratios for the most recent three years are also provided. Since unusual deviation from target values may occur in any given year, the values for the items were averaged balance sheet, common-sized income statement, and financial ratios are 4, respectively. provided for 10 compa- over three years. The three-year average common-sized reported in Exhibits 2, 3, and The 10 companies are drawn from the following 10 different industries: Commercial airline Commercial banking (items fitted into the same Computer software Integrated oil and gas IT service provider Liquor producer and distributor Mobile phone service provider Pharmaceutical preparations Retail grocery stores Semiconductor manufacturer categories as the non-financial firms) Assignment Using the financial statement data provided in Exhibits 2, 3, and 4, match the companies with their industry. Copyright 2007 Thunderbird School of Global Management. All rights reserved. This case was prepared by Professor Graeme Rankine for the purpose of classroom discussion only and not to indicate either effective or incfective manage ment. 69008L ? Exhibit 2 Common-Size Income Statement (percentage; averaged over three years) 2 3 4 6 7 10 NET SALES COST OF GOODS 100.00 100.00 100.00 100.00 100.00 100.00 100.00 100.00 100,00 100.00 79.32 11.11 36.62 49.78 52.77 43.81 23.20 17.03 68.43 58.46 GROSS PROFIT R & D EXPENDITURES SELL GEN & ADMIN EXP 20.68 88.89 63.38 50.22 47.23 56.19 7680 82.97 31.57 41.54 0.00 0.00 20.17 0.00 0.32 0.00 14.61 20.01 17.18 0.00 0.00 19.38 39.91 25.13 14.54 16.01 35.77 33.02 15.56 57.69 INC BEF DEP & AMORT DEPRECIATION & AMORT 1.30 68.72 23.47 24.77 25.58 32.69 4.50 21.03 32.77 16.01 (16.14) 16.72 22.45 0.00 1.18 0.00 3.11 0.00 0.00 0.00 5.94 4.26 NON-OPERATING INC 0.64 (19.23) 18.33 198 (5.09) 184 2.15 0.37 (1.61) 0.90 INTEREST EXPENSE 1.67 0.99 0.18 0.00 0.09 087 0,00 2.37 INCOME BEFORE TAX 0.27 29.98 24.47 16.39 30.04 27.64 20.52 38.71 9.24 (12.78) 8.17 PROV FOR INC TAXES (0.09) 9.98 7.72 6.53 4.18 8.12 5.96 11.57 3.40 MINORITY INT (INC) 0.04 0.00 0.00 0.00 0.07 0.00 0.00 0.00 0.00 0.99 INVEST GAINS/LOSSES 0.00 0.00 0.00 0.00 0.21 0.00 0.00 0.00 0,00 0.00 0.10 0.00 0.00 0.00 0.00 (0.21) 25.78 OTHER INCOME 0.00 0.00 0.00 0.00 NET INC BEF EX ITEMS 0.41 20.00 16.75 9.86 19.51 14.57 27.14 584 (21.94) (383) EX ITEMS & DISC OPS 0.35 0.00 (1.85) 0.00 0.21 0,00 (0.05) 0.00 0.00 NET INCOME 0.76 20.00 14.90 9.86 25.99 19.51 14.52 27.14 584 (25.78) Source: Thomson Banker One-Analytics Exhibit 3 Common-Size Balance Sheet (percentage; averaged over three years) 2 2,66 20.51 7 15.99 6.75 11.26 9.07 0.59 10 CASH MRKTABLE SECURITIES: RECEIVABLES INVENTORIES RAW MATERIALS WORK IN PROGRESS FINISHED GOODS NOTES RECEIVABLE OTHER CURRENT ASSETS TOTAL CURRENT ASSETS PROP. PLANT&EQUIP ACCUMULATED DEP NET PROP & EQUIP INVEST &ADV TO SUBS OTHER NON-CUR ASSETS DEFERRED CHARGES INTANGIBLES DEPOSITS & OTH ASSET TOTAL ASSETS 10.47 1.96 12.61 20.12 11.13 3.88 5.10 0.00 6.25 51.41 33.72 15.99 17.73 0.63 0,00 35.47 14.27 1542 12.17 3.10 52.44 9.92 109 031 0.00 11.87 3.17 1.93 2.90 0.00 10.16 0.00 0.00 19.77 0.00 3.60 0.28 0.00 0,00 45.93 13.13 474 073 0.00 4.01 6.64 11.78 16.49 0,00 0.00 6.94 1.20 (0.24) 0,00 12.02 0,00 12.50 0.00 000 0.97 3.54 2.44 0.00 2.69 43.88 1.20 0,00 5.90 0.00 0.00 0.00 0.00 2.58 0.78 0,00 0.28 0.00 0,00 0.00 0,00 0,00 0.31 7,09 0,00 0.00 143 33.57 119.29 6632 5297 9.45 0.00 0.74 0.00 3.27 6.81 62.05 3.50 4656 480 3.14 2131 40.44 85.59 0.64 0,00 0,64 71.34 3733 21.80 000 21 H0 90.48 55.18 21.95 33.23 4.03 875 5.37 3.38 13.91 0.00 3.05 5.20 99.65 11.64 0.00 55.62 34.85 26.90 7275 0.00 11.64 37.33 529 0.29 3.13 12.98 0.54 100.00 0.08 0.00 0.00 4.66 9,03 100,00 1483 0.00 071 0.61 0,00 100.00 8.50 1.56 0.00 0.00 0.16 421 100.00 16.70 0.00 0.00 0.05 1,66 20.87 7.70 3.02 0.23 941 3.13 100,00 0.30 6139 2.83 100,00 0.53 12.62 100.00 3.11 100.00 100.00 100.00 NOTES PAYABLE ACCOUNTS PAYABLE CUR LONG TERM DEBT CUR PORT CAP LEASES ACCRUED EXPENSES INCOME TAXES OTHER CURRENT LIAB TOTAL CURRENT LIAB MORTGAGES 2.88 23.36 50.78 0,68 000 3.0 0.00 0,00 7786 3.45 3.38 3.51 0.00 732 1.79 0.70 20.16 0.00 5.18 085 11.68 0.26 0.00 2.51 0.00 0.09 044 445 004 0.00 2.25 0.00 2.98 0.00 0.00 3.46 2.93 0.00 002 193 1.79 001 15.26 4.57 0.38 3.13 4.06 2.07 0.07 9.24 000 0.00 8.86 1.79 0.00 2.30 6.70 0.01 534 35.15 8.19 3.40 6.11 0.00 0.93 10.79 0.00 3.41 0.00 4.04 2.85 22.18 544 12.55 26.94 000 4.46 11.73 25.65 0,00 1.98 5.06 22.47 2.83 126 17.78 000 1.26 14.61 23.98 0.00 0.18 0.00 0.00 DEFERRED CHARGESINC CONVERTIBLE DEBT LONG TERM DEBT NON-CUR CAP LEASES OTHER LONG TERM LIAB 133 0.00 11.86 0.00 2.74 0.13 8.79 45.69 182 0.00 0.00 0,00 0,00 0.00 1,87 0.00 19.14 0.00 2.22 0.00 0.00 1545 0,00 8.82 0.50 2.07 52.14 0.00 131 25.09 0.00 8.17 0.00 5.26 91.28 0.00 437 17.54 (1.16) 9.66 0.08 6.93 6.83 0.00 6.17 49.06 000 0.00 0.74 23.00 0.00 0,00 5.52 000 739 1.42 25.36 0.62 26.94 76.82 0.31 TOTAL LIABILIITIES MINORITY INT (LIAB) PREFERRED STOCK COMMON STOCK NET CAPITAL SURPLUS RETAINED EARNINGS TREASURY STOCK 31.71 0,00 54.06 0.00 0.24 107 138 0.00 0.00 2.98 2.28 0,08 0,00 0.74 137 0.00 0.01 13.94 0.00 0.00 0.43 1.81 3.81 0.00 2.51 76.62 6.20 3.04 63.20 0.00 78.79 12.93 57.19 0.00 14.11 000 4.70 8645 (44.84) 0.00 5.31 54.55 62.90 43.22 (9.99) 0,00 33.37 (36.41) 3.56 0,00 5.60 28.07 0.00 0.15 77.00 100.00 0.43 1.17 4,76 47.86 OTHER EQUITIES SHAREHOLDER EQUITY TOT LIAB & NET WORTH 0.42 (0.48) 72 (0.11) 50.94 (13.94) (074) 0,25 7282 100.00 1.66 68.29 24.08 74.02 100.00 22.87 45.94 100.00 100.00 100.00 100.00 100.00 100.00 100.00 Source: Thomson Banker One-Analytics Exhibit 2 Common-Size Income Statement (percentage; averaged over three years) 2 3 4 6 7 5 8 10 NET SALES COST OF GOODS GROSS PROFIT 100.00 79.32 100.00 100.00 100.00 100.00 100.00 100.00 100.00 100.00 100.00 11.11 36.62 49.78 52.77 43.81 23.20 17.03 68.43 58 46 20.68 88.89 63.38 50.22 47.23 56.19 76.80 82.97 31.57 41.54 R & D EXPENDITURES SELL GEN & ADMIN EXP 0.00 0,00 0,00 0.32 0,00 14.61 20.01 17.18 0,00 0,00 19.38 20.17 39.91 25.13 14.54 16.01 35.77 33.02 15.56 57,69 INC BEF DEP & AMORT 1.30 68.72 2347 24.77 32.69 25.58 21.03 32.77 16.01 (16.14) DEPRECIATION & AMORT 0.00 1.18 0,00 3.11 4.50 1.84 0.00 0.00 0,00 NON-OPERATING INC 4.26 16.72 0,64 (19.23) 1.98 (5.09) 2.15 0.37 5.94 (1,61) 0.90 INTEREST EXPENSE 22.45 1.67 18.33 0,99 0.18 0.00 0.09 0.87 0.00 2.37 INCOME BEFORE TAX 0.27 29.98 2447 16.39 30.04 27.64 20.52 38.71 11.57 9.24 PROV FOR INC TAXES (12.78) 8.17 (0.09) 9.98 7.72 6.53 4.18 8.12 5.96 MINORITY INT (INC) 3.40 0.04 0,00 0,00 0.00 0,07 0.00 0,00 0.00 INVEST GAINS/LOSSES OTHER INCOME NET INC BEF EX ITEMS 0,00 0.99 0,00 0.00 0.00 0.00 0.21 0.00 0.00 0.00 0.00 0.00 0.10 0.00 0.00 0.00 (0.21) 25.78 0,00 0.00 0.00 0.00 0.41 0.00 20.00 16.75 9.86 19.51 14.57 EX ITEMS& DISC OPS 27.14 5.84 0.35 (21.94) (383) 0,00 (1.85) 0.00 0.21 0,00 (0.05) NET INCOME 0,00 0,00 0.76 20.00 14.90 9.86 25.99 19.51 14,52 27.14 5,84 (25.78) Source: Themon Banker One Analyties