Question
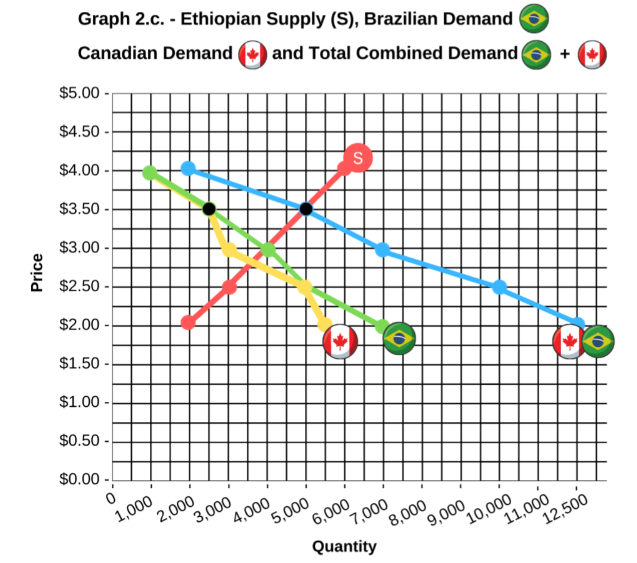
Graph 2.c. depicts the individual demand curves for both Brazil and Canada, the new combined demand curve, and the supply curve for Ethiopian coffee beans.

Graph 2.c. depicts the individual demand curves for both Brazil and Canada, the new combined demand curve, and the supply curve for Ethiopian coffee beans.

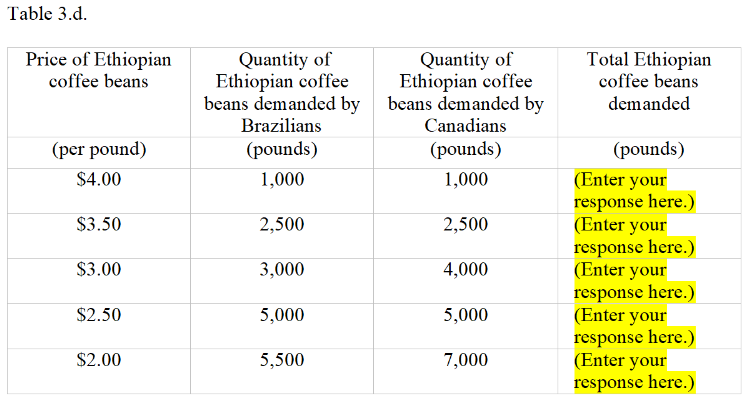
c. From the supply schedule and the combined Brazilian and Canadian demand schedule, what will be the new equilibrium price at which Ethiopian coffee growers will sell Ethiopian coffee beans, and what is the total quantity that will be consumed by both countries?
(Enter your response here.)
d. With the Ethiopian coffee growers selling to both the Canadians and the Brazilians, what will be the new equilibrium price paid and quantity demanded by Brazilian consumers?
(Enter your response here.)
e. With the Ethiopian coffee growers selling to both the Canadians and the Brazilians, what will be the new equilibrium price paid and quantity demanded by Canadian consumers?
(Enter your response here.)
Table 3.d. Graph 2.c. - Ethiopian Supply (S), Brazilian Demand Canadian Demand and Total Combined Demand
Step by Step Solution
There are 3 Steps involved in it
Step: 1

Get Instant Access to Expert-Tailored Solutions
See step-by-step solutions with expert insights and AI powered tools for academic success
Step: 2

Step: 3

Ace Your Homework with AI
Get the answers you need in no time with our AI-driven, step-by-step assistance
Get Started


