Answered step by step
Verified Expert Solution
Link Copied!

Question

1 Approved Answer

Graph each of these three data sets and describe what features appear in the data. (trend, seasonality, step change, black swan, high variation, stability, instability,

Graph each of these three data sets and describe what features appear in the data.

(trend, seasonality, step change, black swan, high variation, stability, instability, etc.)

1) a. Set 1 features:

b. Set 2 features:

c. Set 3 features:
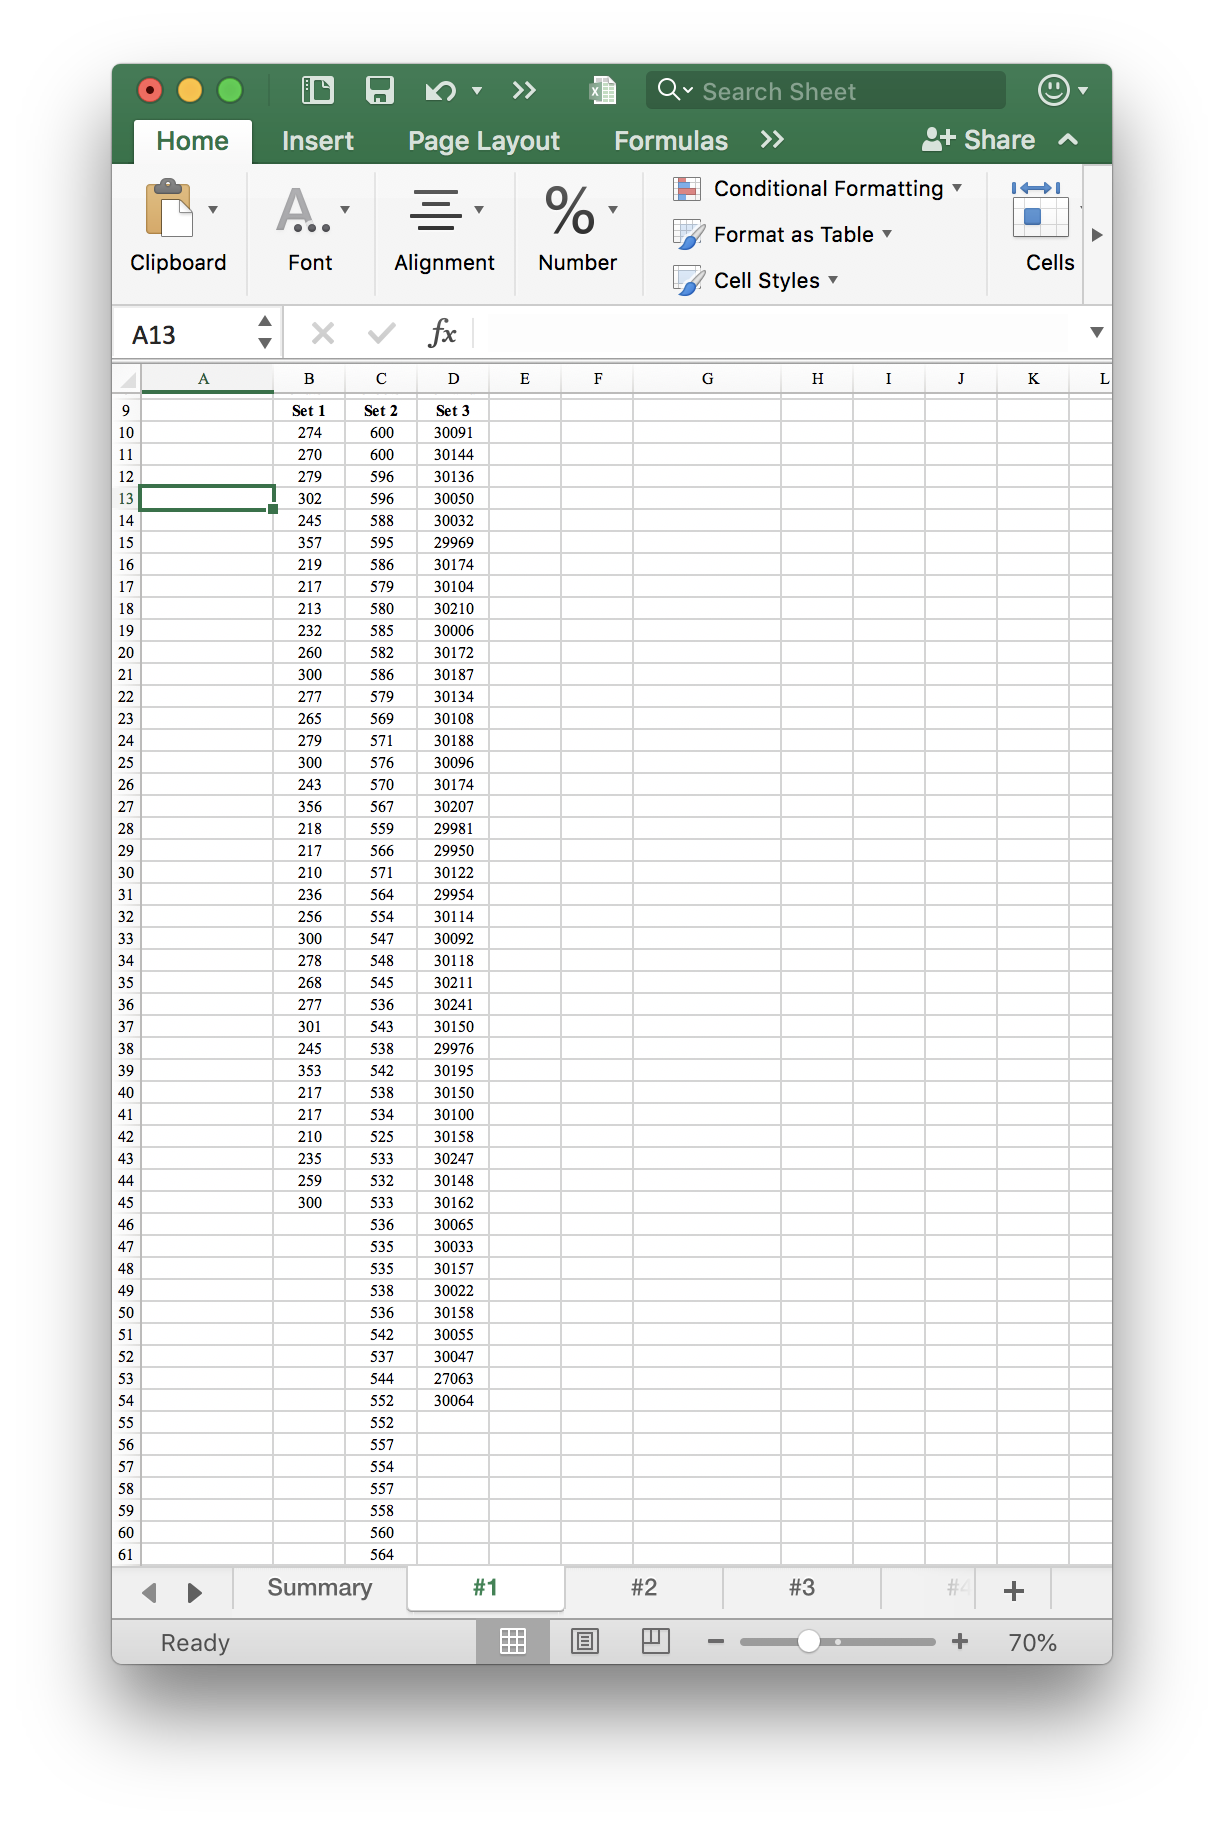
image text in transcribed
Q Search Sheet Home Insert Page Layout Formulas >> "+ Share ~ A. % |Conditional Formatting IHI Format as Table Clipboard Font Alignment Number Cell Styles Cells A13 X V fx A B C D E F G H I J K L 9 Set 1 Set 2 Set 3 10 274 600 30091 11 270 600 30144 279 596 30136 13 302 596 30050 14 245 588 30032 357 595 29969 219 586 30174 217 579 30104 213 580 30210 232 585 3000 260 582 30172 300 586 30187 277 579 30134 265 569 30108 279 571 30188 300 576 30096 26 243 570 30174 27 356 567 30207 28 218 559 29981 29 30 217 566 29950 210 571 30122 31 236 564 29954 32 256 554 30114 33 300 547 30092 34 278 548 30118 35 268 545 3021 36 277 536 30241 37 301 543 30150 38 245 538 29976 39 353 542 30195 40 217 538 30150 41 42 217 534 30100 210 525 30158 43 235 533 3024 44 259 532 30148 45 300 533 30162 46 536 30065 535 30033 535 30157 538 30022 536 30158 542 3005 537 30047 544 27063 552 30064 552 557 554 557 558 560 564 Summary #1 #2 #3 #4 + Ready + 70%

Step by Step Solution

There are 3 Steps involved in it

Step: 1

blur-text-image

Get Instant Access to Expert-Tailored Solutions

See step-by-step solutions with expert insights and AI powered tools for academic success

Step: 2

blur-text-image_2

Step: 3

blur-text-image_3

Ace Your Homework with AI

Get the answers you need in no time with our AI-driven, step-by-step assistance

Get Started

Recommended Textbook for

Management

Authors: Chuck Williams

4th Edition

978-0324316797, 0324316798

More Books

Students also viewed these General Management questions