Answered step by step
Verified Expert Solution
Question
1 Approved Answer
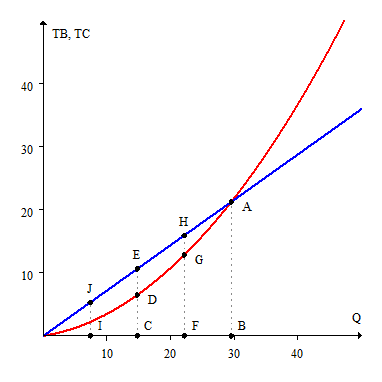
Graph of TB & TC of Hours Working : The graph below measures salary (thousands per year) and perceived costs from working for a single
Graph of TB & TC of Hours Working: The graph below measures salary (thousands per year) and perceived costs from working for a single worker. The worker perceives their total cost equation for working to beTC =. The horizontal axis measures the hours of working per week that they can choose, giving them a total benefit of working equation,TB =. (For hours beyond 40, assume thatTC>TB.)

Step by Step Solution
There are 3 Steps involved in it
Step: 1

Get Instant Access to Expert-Tailored Solutions
See step-by-step solutions with expert insights and AI powered tools for academic success
Step: 2

Step: 3

Ace Your Homework with AI
Get the answers you need in no time with our AI-driven, step-by-step assistance
Get Started


