graph one details INSERT INFLATION GRAPH HERE (Copy and paste powerpoint file image here) You will need to refer to your original graph to respond
graph one details
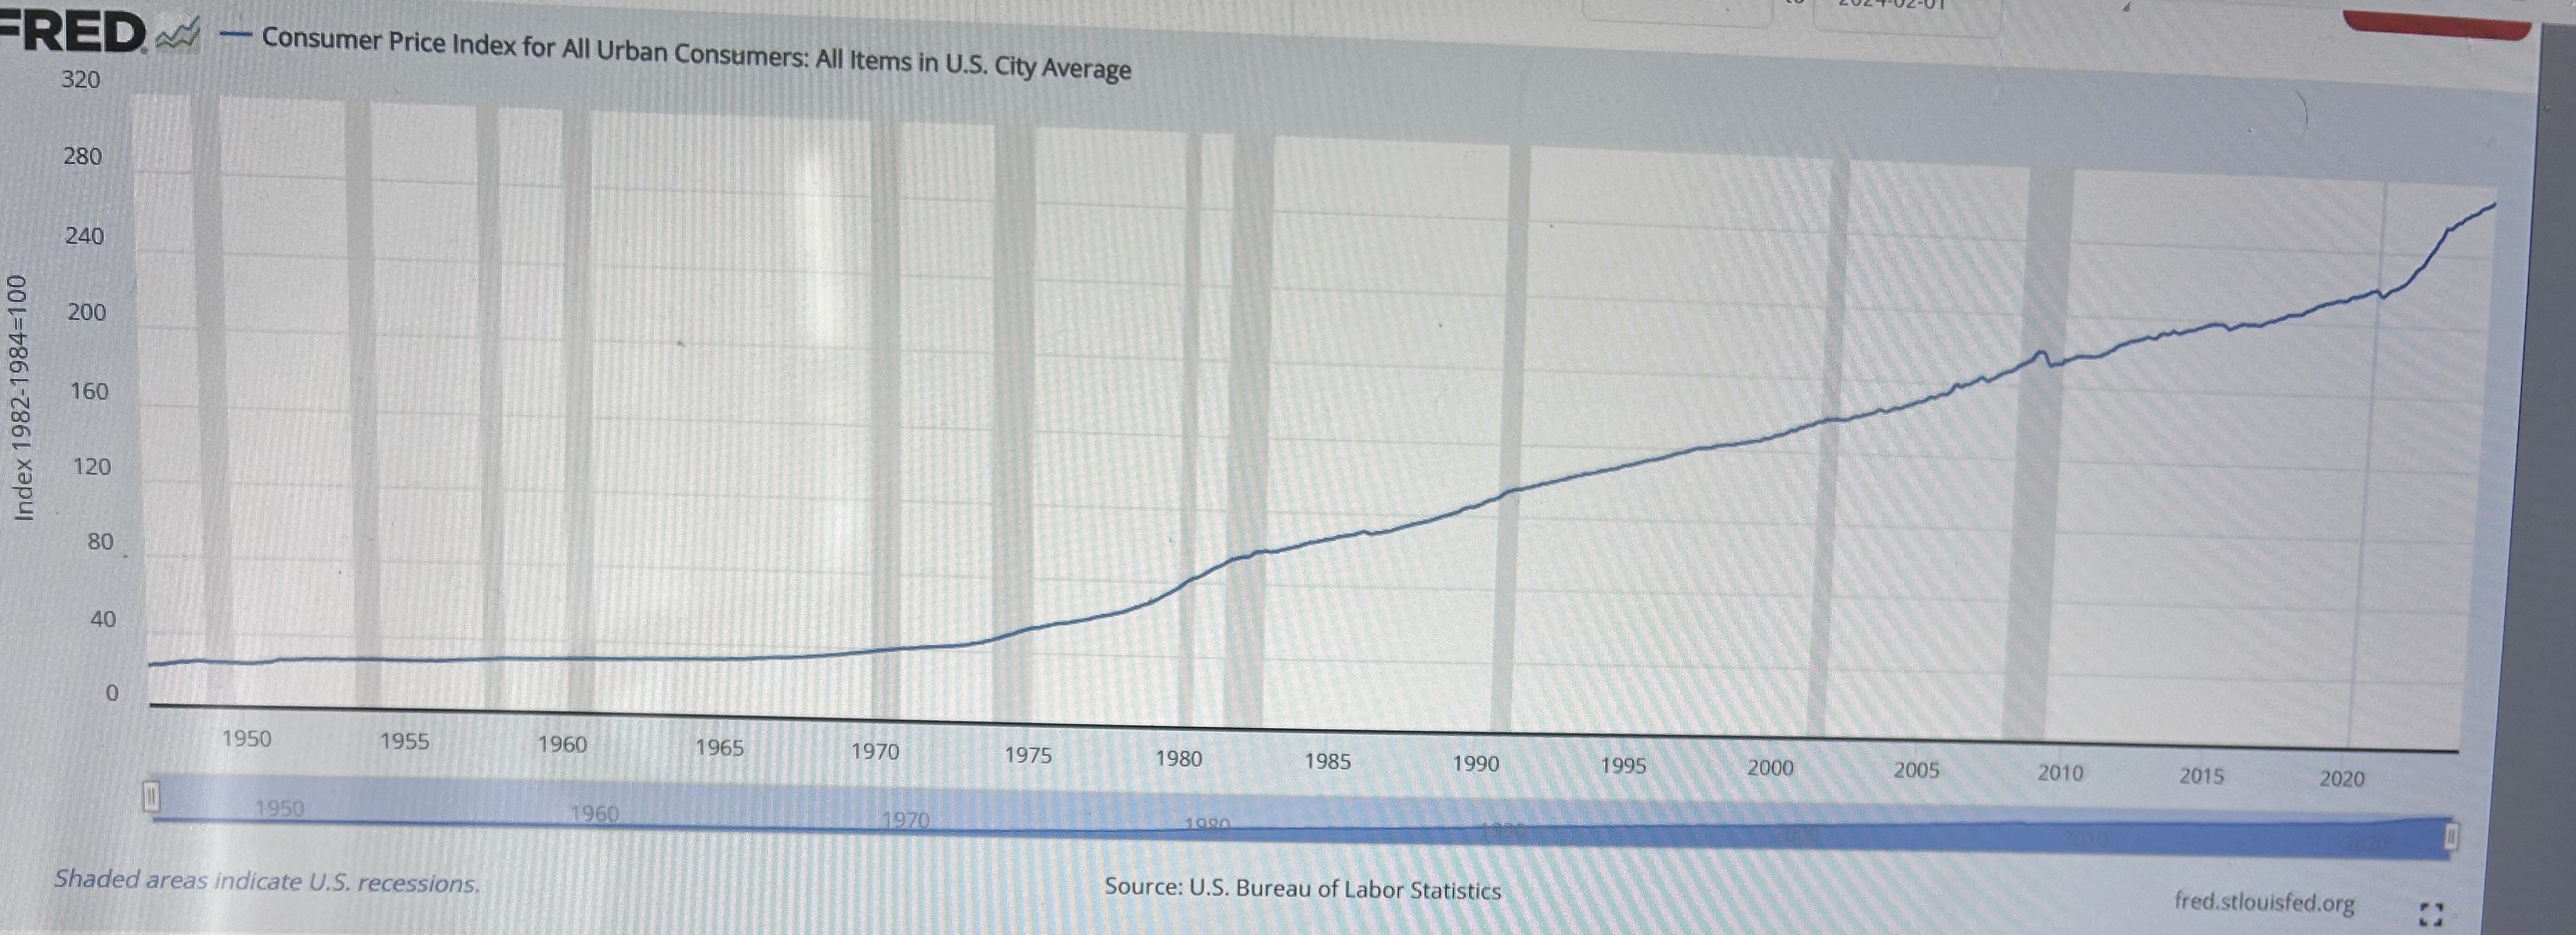
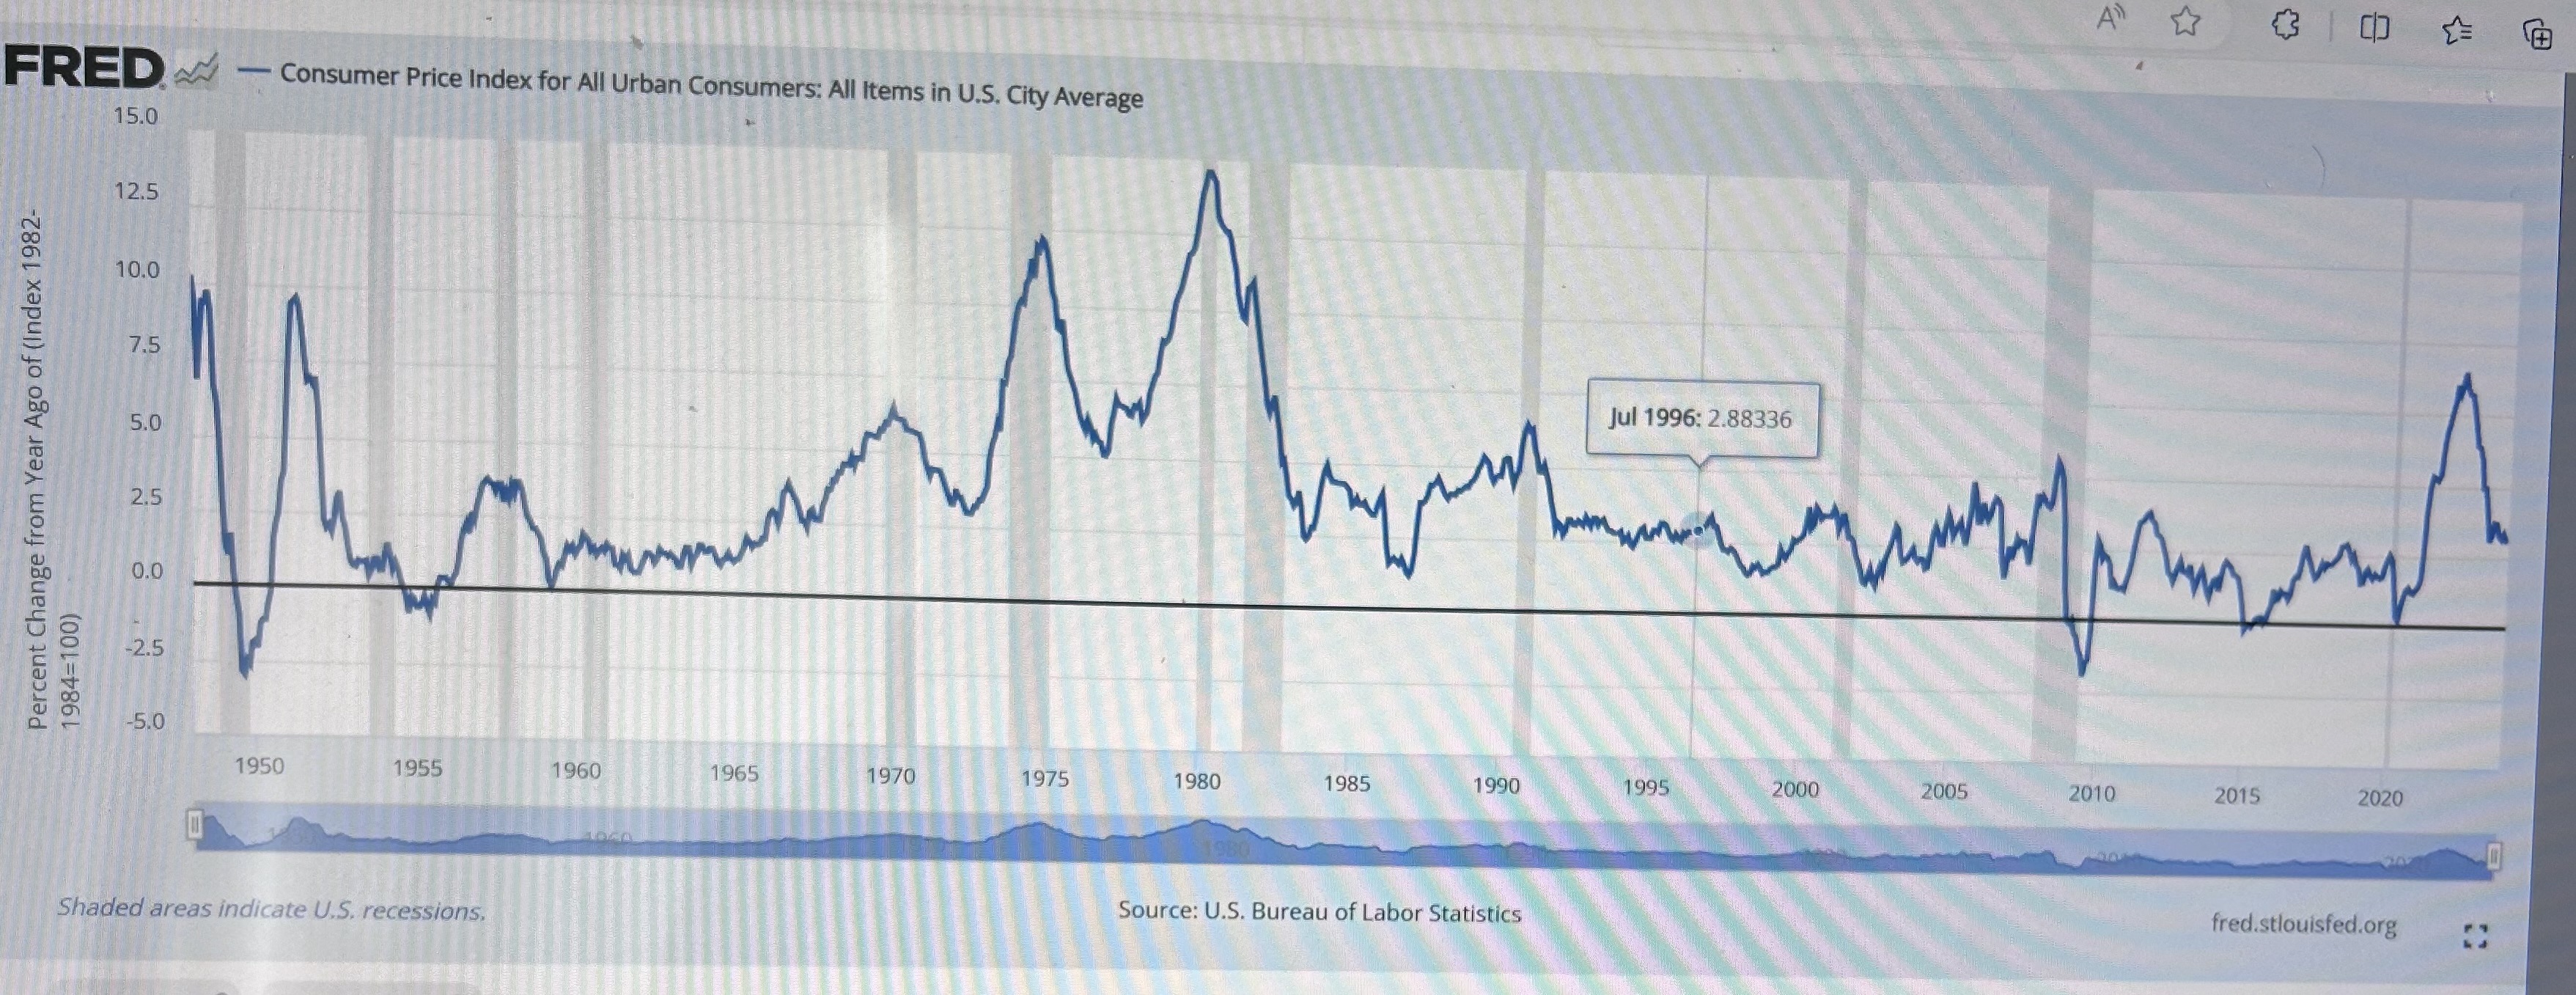
INSERT INFLATION GRAPH HERE (Copy and paste powerpoint file image here) You will need to refer to your original graph to respond the following questions. All work must be typewritten. Questions on Graph #1 1. View the graph. What agency reports this data? 2. Using your saved graph, drag the mouse along the line in the plot area. You will see a vertical line giving you a value for the CPI at each of the dates. By what frequency are the periods changing? In what units are the values? What are the base years? (Information is also located above graph) (Base years are the years in which the index is set to 100) 3. Place the cursor on the most recent point to find a current value for the CPI. What is the current CPI? In what month/year is this reported? is it simple to determine the rate of inflation from this measure alone? Questions on Graph #2 What is the current inflation rate (as measured by the CPI) and in what month year is this reported?5. What is the highest rate of (CPI) inflation since December 2007? In what month/year is this reported? 6. What is the lowest rate of (CPI) inflation since December 2007? In what month year is this reported? 7. Starting with 1948, how do the lowest rates of inflation during past recessions compare with that during the Great Recession? Cite some numbers to make your comparison. How does it make the Great Recession different from the others? What happens to inflation in or around recessions? 8. Starting with 1948, how do past peaks of inflation compare with the most recent peak of inflation? Cite data to make your comparison.Source: U.S. Bureau of Labor Statistics Release: Consumer Price index [ Units: Index 1982-1984-100, Seasonally Adjusted Frequency: Monthly The Consumer Price Index for All Urban Consumers: All Items (CPIAUCSL) is a price index of a basket of goods and services paid by urban consumers. Percent changes in the price index measure the inflation rate between any two time periods. The most common inflation metric is the percent change from one year ago. It can also represent the buying habits of urban consumers. This particular index includes roughly 88 percent of the total population, accounting for wage earners. clerical workers, technical workers, self-employed, short-term workers, unemployed, retirees, and those not in the labor force. The CPIs are based on prices for food, clothing, shelter, and fuels; transportation fares, service fees (e.g., water and sewer service); and sales taxes. Prices are collected monthly from about 4,000 housing units and approximately 26,000 retail establishments across 87 urban areas. To calculate the index, price changes are averaged with weights representing their importance in the spending of the particular group. The index measures price changes (as a percent change) from a predetermined reference date. In addition to the original unadjusted index distributed, the Bureau of Labor Statistics also releases a seasonally adjusted index. The unadjusted series reflects all factors that may influence a change in prices. However, it can be very useful to look at the seasonally adjusted CPI, which removes the effects of seasonal changes, such as weather, school year, production cycles. and holidays. The CPI can be used to recognize periods of inflation and deflation Significant increases in the CPI within a short time frame might indicate a period of inflation, and significant decreases in CPI within a short time frame might indicate a period of deflation. However, because the CPI includes volatile food and oil prices, it might not be a reliable measure of inflationary and deflationary periods. For a more accurate detection, the core CPI (CPILFESL) is often used. When using the CPI, please note that it is not applicable to all consumers and should not be used to determine relative living costs. Additionally, the CPI is a statistical measure vulnerable to sampling error since it is based on a sample of prices and not the complete average. For more information on the consumer price indexes, see Bureau of Economic Analysis. "CPI Detailed Report." 2013. Handbook of Methods Understanding the CPI: Frequently Asked Questions Suggested Citation: U.S. Bureau of Labor Statistics, Consumer Price Index for All Urban Consumers All Items in U.S. City Average [CPIAUCSL], retrieved from FRED. Federal Reserve Bank of St. Louis; https://fred_stlouisfed.org/series/CPIAUCSL, March 16, 2024RED. ~- Consumer Price Index for All Urban Consumers: All Items in U.S. City Average 320 280 240 200 160 Index 1982-1984=100 120 80 40 0 2010 2015 2020 1950 1955 1960 1965 1970 1975 1980 1985 1990 1995 2000 2005 1950 1960 970 1090 Source: U.S. Bureau of Labor Statistics fred.stlouisfed.org Shaded areas indicate U.S. recessions.FRED ~- Consumer Price Index for All Urban Consumers: All Items in U.S. City Average 15.0 12.5 10.0 7.5 Jul 1996: 2.88336 5.0 Percent Change from Year Ago of (Index 1982- 2.5 0.0 -2.5 1984=100) -5. 1950 1955 1960 1965 1970 1975 1980 1985 1990 1995 2000 2005 2010 2015 2020 Shaded areas indicate U.S. recessions, Source: U.S. Bureau of Labor Statistics fred.stlouisfed.orgSource: U.S. Bureau of Labor Statistics Release: Consumer Price Index Units: Index 1982-1984-100, Seasonally Adjusted Frequency: Monthly The Consumer Price Index for All Urban Consumers: All Items (CPIAUCSL) is a price index of a basket of goods and services paid by urban consumers. Percent changes in the price index measure the inflation rate between any two time periods. The most common inflation metric is the percent change from one year ago. It can also represent the buying habits of urban consumers. This particular index includes roughly 88 percent of the total population, accounting for wage earners, clerical workers, technical workers, self-employed, short-term workers, unemployed, retirees, and those not in the labor force. The CPIs are based on prices for food, clothing, shelter, and fuels, transportation fares; service fees (e.g., water and sewer service); and sales taxes. Prices are collected monthly from about 4,000 housing units and approximately 26,000 retail establishments across 87 urban areas. To calculate the index, price changes are averaged with weights representing their importance in the spending of the particular group. The index measures price changes (as a percent change) from a predetermined reference date. In addition to the original unadjusted index distributed, the Bureau of Labor Statistics also releases a seasonally adjusted index. The unadjusted series reflects all factors that may influence a change in prices. However, it can be very useful to look at the seasonally adjusted CPI, which removes the effects of seasonal changes, such as weather, school year, production cycles, and holidays The CPI can be used to recognize periods of inflation and deflation. Significant increases in the CPI within a short time frame might indicate a period of inflation, and significant decreases in CPI within a short time frame might indicate a period of deflation. However, because the CPI includes volatile food and oil prices, it might not be a reliable measure of inflationary and deflationary periods. For a more accurate detection, the core CPI (CPILFESL) is often used. When using the CPI, please note that it is not applicable to all consumers and should not be used to determine relative living costs. Additionally, the CPI is a statistical measure vulnerable to sampling error since it is based on a sample of prices and not the complete average. For more information on the consumer price indexes, see Bureau of Economic Analysis. "CPI Detailed Report " 2013 Handbook of Methods Understanding the CPI: Frequently Asked Questions Suggested Citation: U.S. Bureau of Labor Statistics, Consumer Price Index for All Urban Consumers: All Items in U.S. City Average [CPIAUCSL], retrieved from FRED, Federal Reserve Bank of St. Louis, https://fred.stlouisfed.org/series/CPIAUCSL, March 16, 2024
Step by Step Solution
There are 3 Steps involved in it
Step: 1
Get Instant Access to Expert-Tailored Solutions
See step-by-step solutions with expert insights and AI powered tools for academic success
Step: 2
Step: 3
Ace Your Homework with AI
Get the answers you need in no time with our AI-driven, step-by-step assistance